Prof. Narayanaswamy Balakrishnan, Department of Mathematics and Statistics, McMaster University
Sunday, November 12, 2023, 15:30
- 16:30
Building 1, Level 4, Room 4102
Contact Person
In this talk, I will describe the family of mean-mixtures of multivariate normal distributions and establish many of its properties, stochastic representations, moments, distributional shape characteristics, etc.
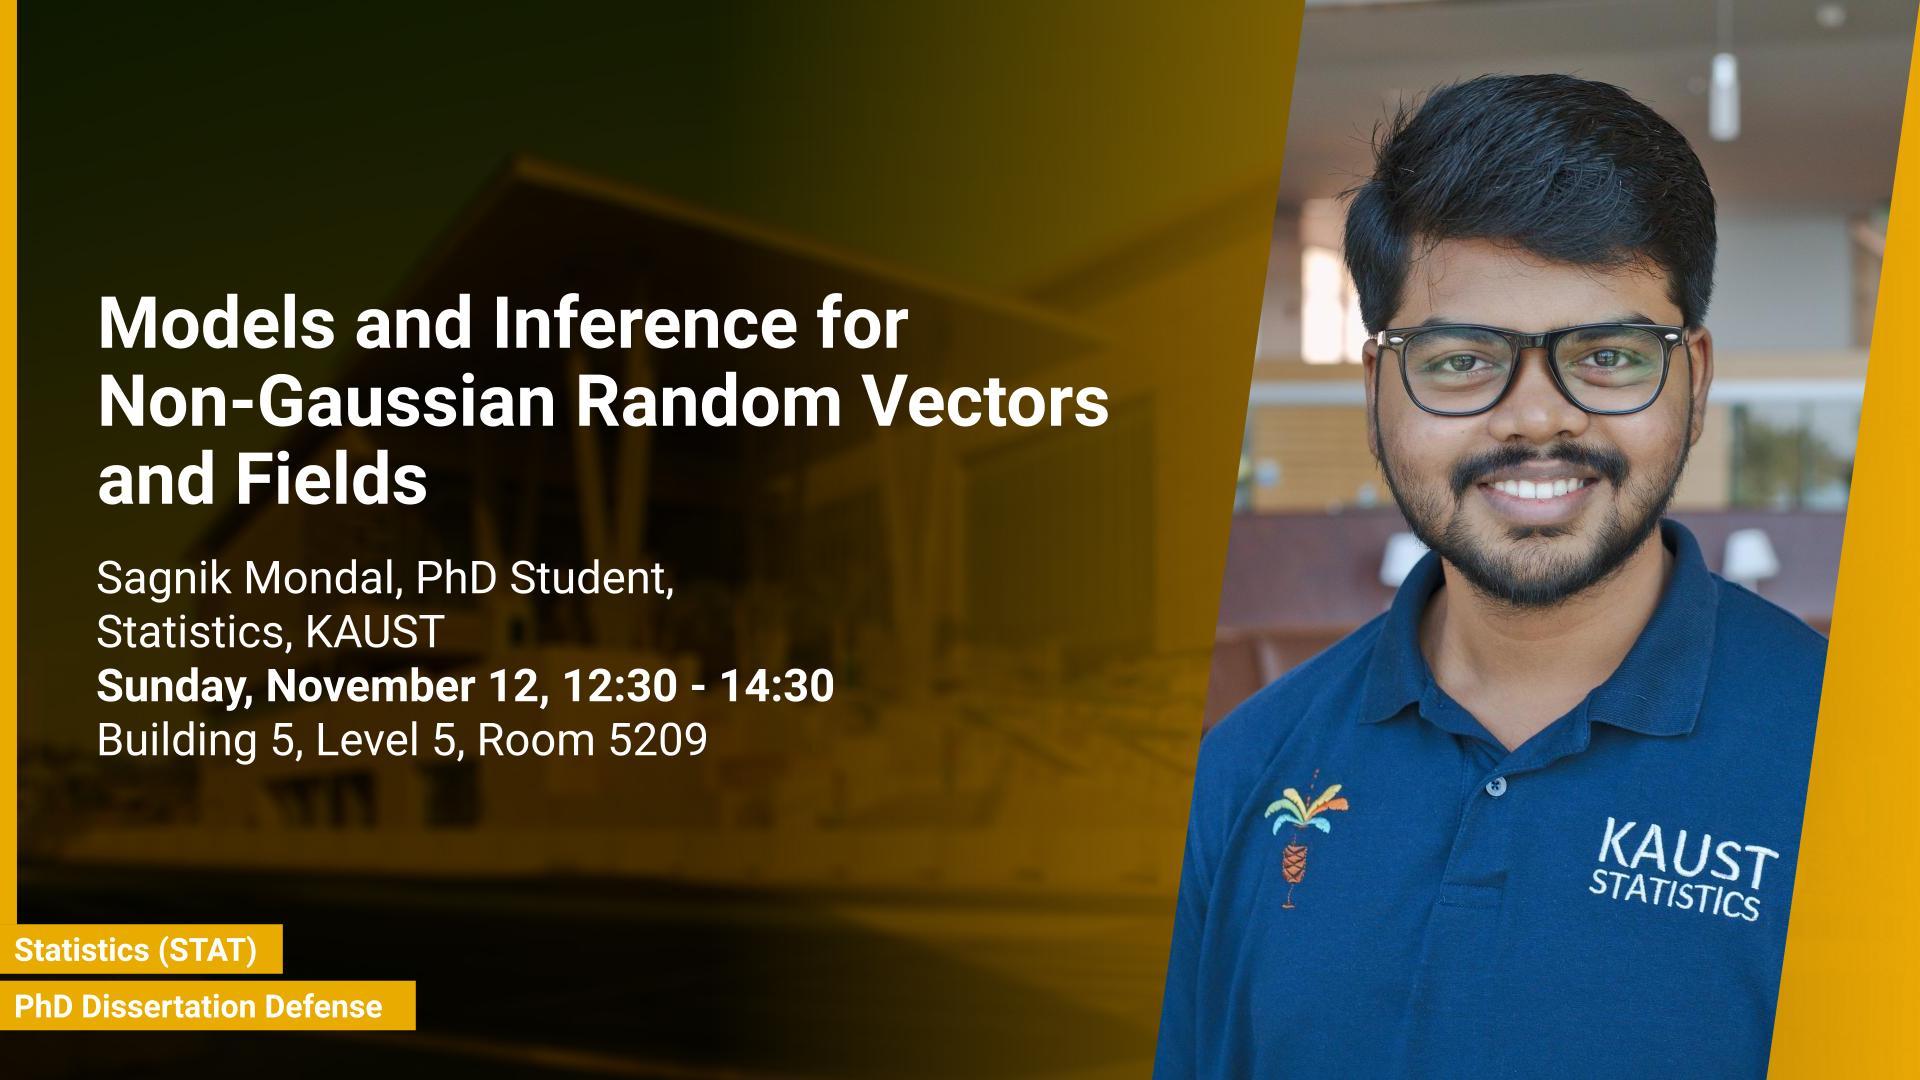
Sunday, November 12, 2023, 12:30
- 14:30
Building 5, Level 5, Room 5209
Contact Person
The multivariate Gaussian distribution is widely used in many statistical applications due to its appealing features. However, real-world data often violate its assumptions, showing skewness and/or tail-thickness.
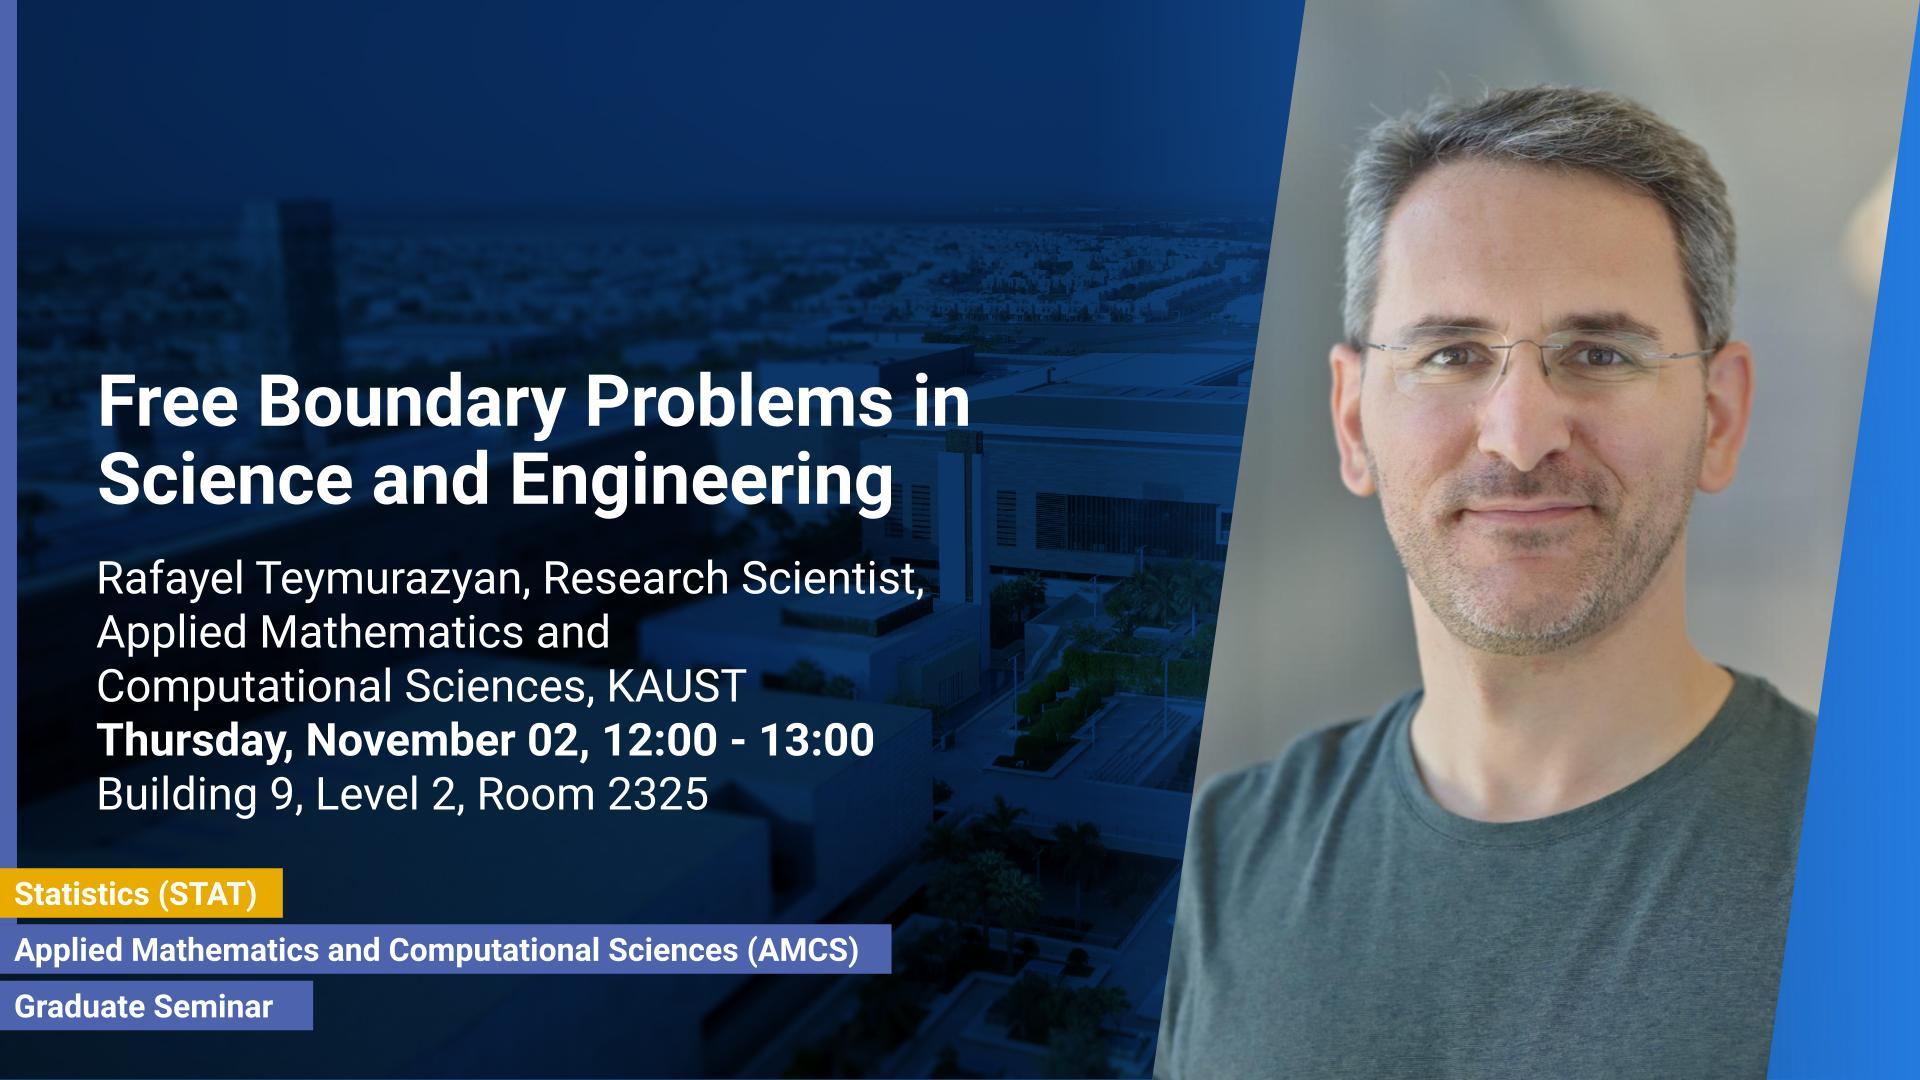
Thursday, November 02, 2023, 12:00
- 13:00
Building 9, Level 2, Room 2325
Free boundary problems arise naturally in a range of mathematical models that describe physical, biological or financial phenomena, such as the melting of ice into water, the dynamics of a population or the behavior of stock markets, to mention just a few.
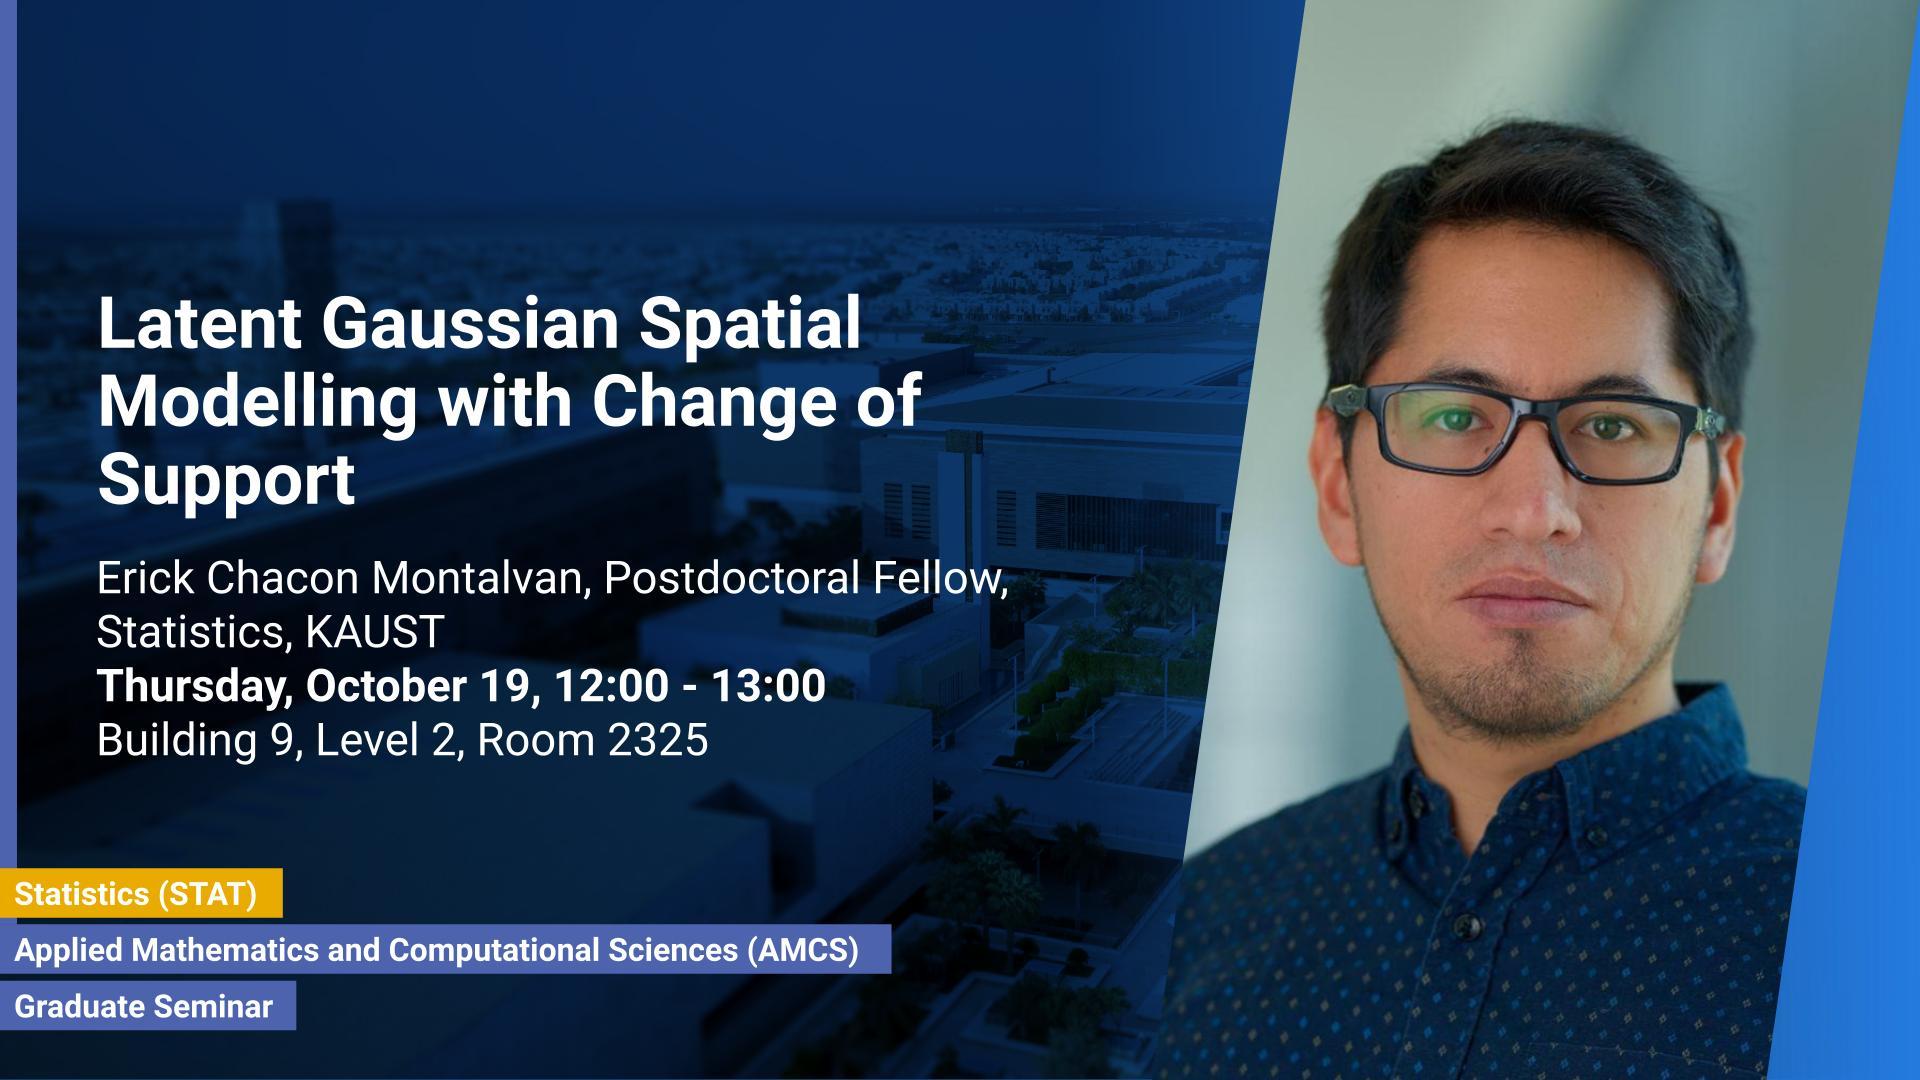
Erick Chacon Montalvan, Postdoctoral fellow, Statistics Geohealth Group, KAUST
Thursday, October 19, 2023, 12:00
- 13:00
Building 9, Level 2, Room 2325
Spatial data analysis commonly needs to deal with spatial data derived from multiple sources (e.g. satellites, stations, survey samples) with different supports, but associated with the same properties of a spatial phenomenon under interest. Usually, predictors are also measured on different spatial supports than the response variable.
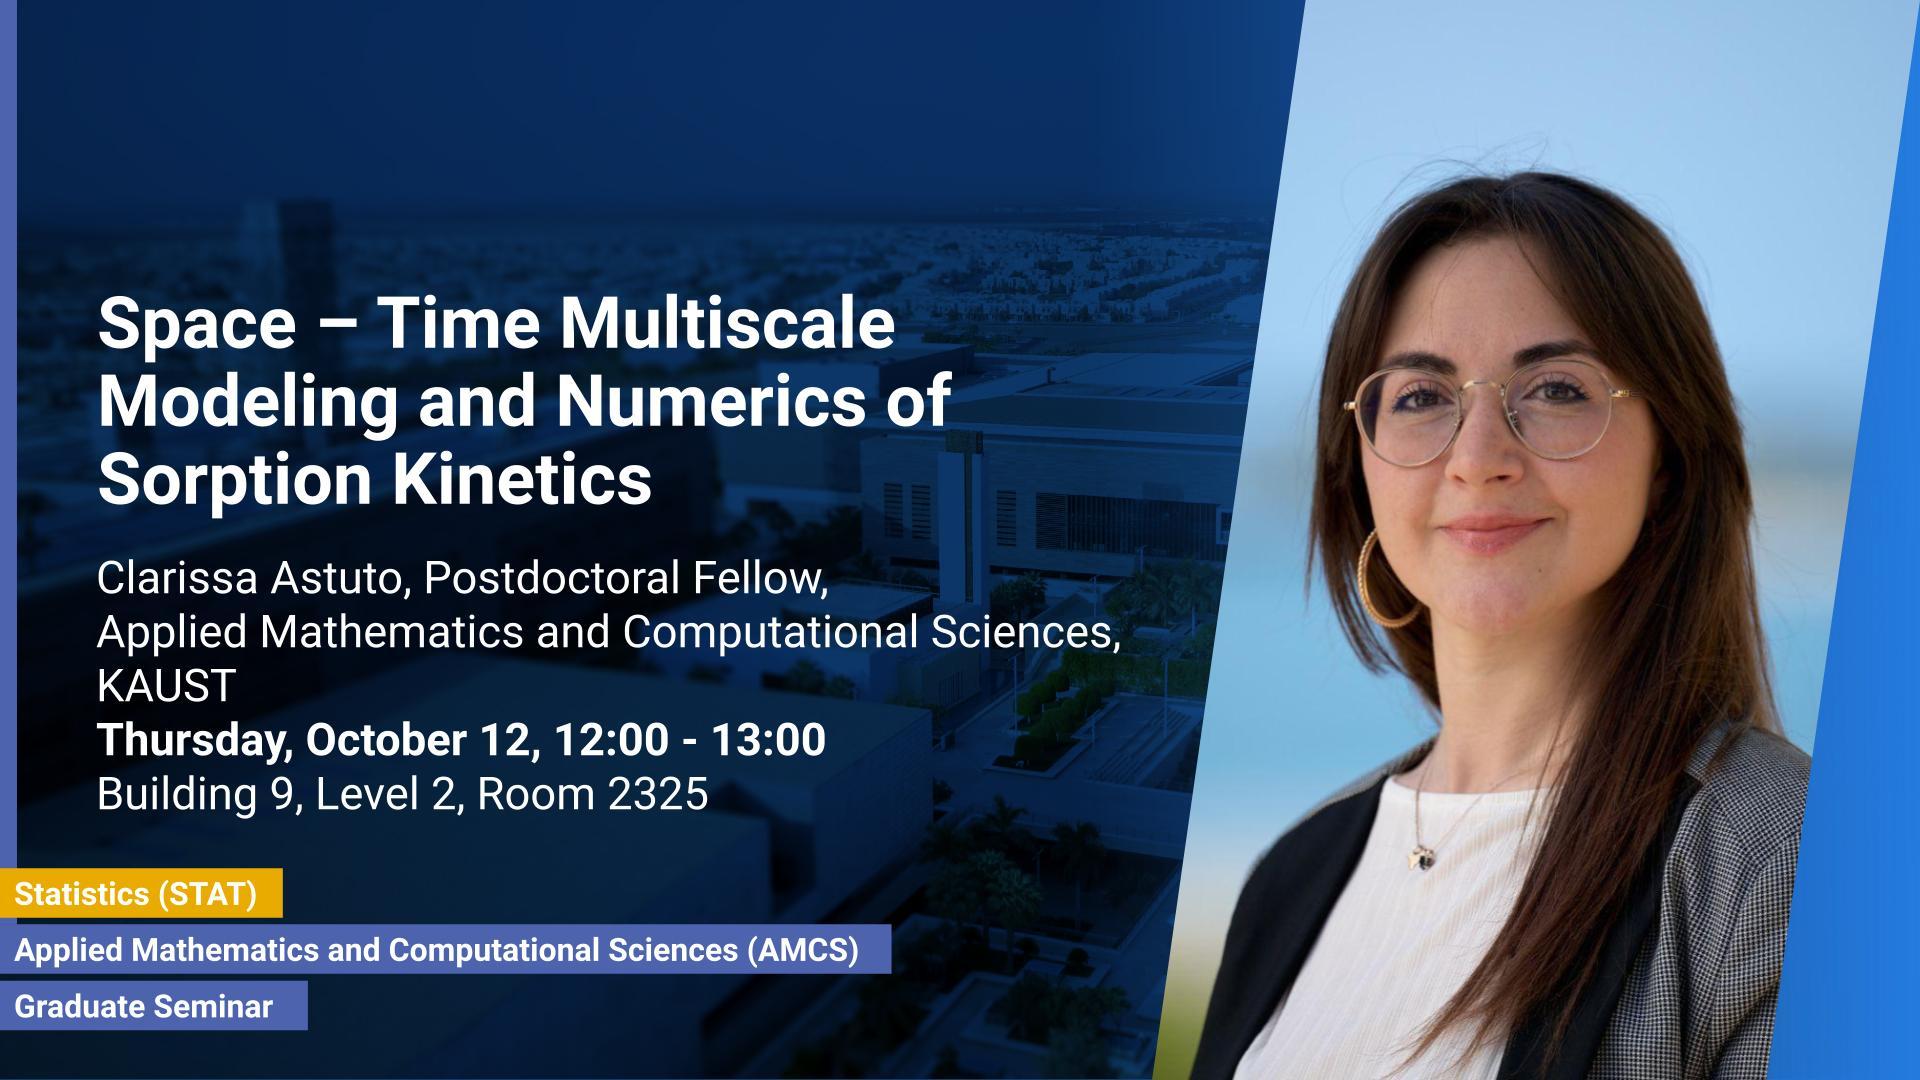
Thursday, October 12, 2023, 12:00
- 13:00
Building 9, Level 2, Room 2325
In this talk we propose and validate a Space Multiscale model for the description of particle diffusion in the presence of trapping boundaries. We start from a drift diffusion equation in which the drift term describes the effect of bubble traps, and it is simulated by the Lennard–Jones potential.
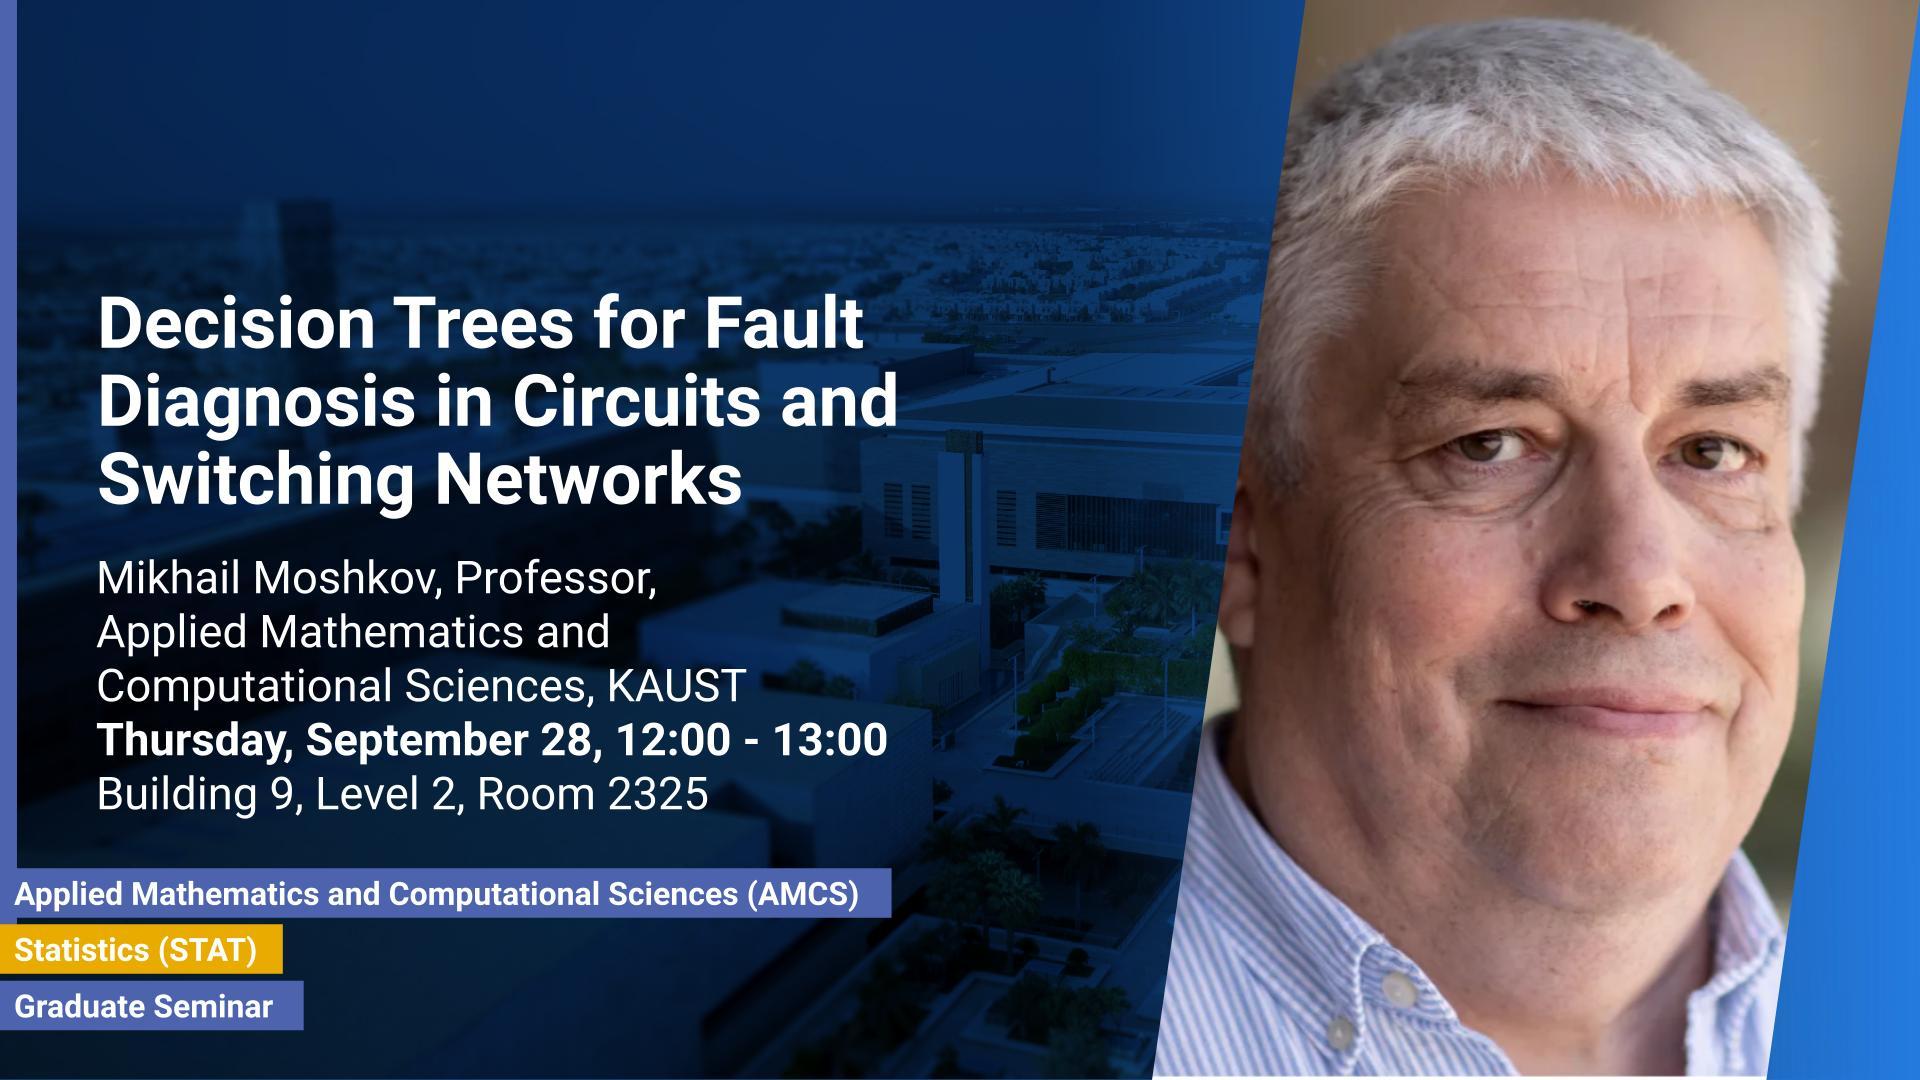
Thursday, September 28, 2023, 12:00
- 13:00
Building 9, Level 2, Room 2325
We study theoretical problems of fault diagnosis in circuits and switching networks, which are among the most fundamental models for computing Boolean functions.
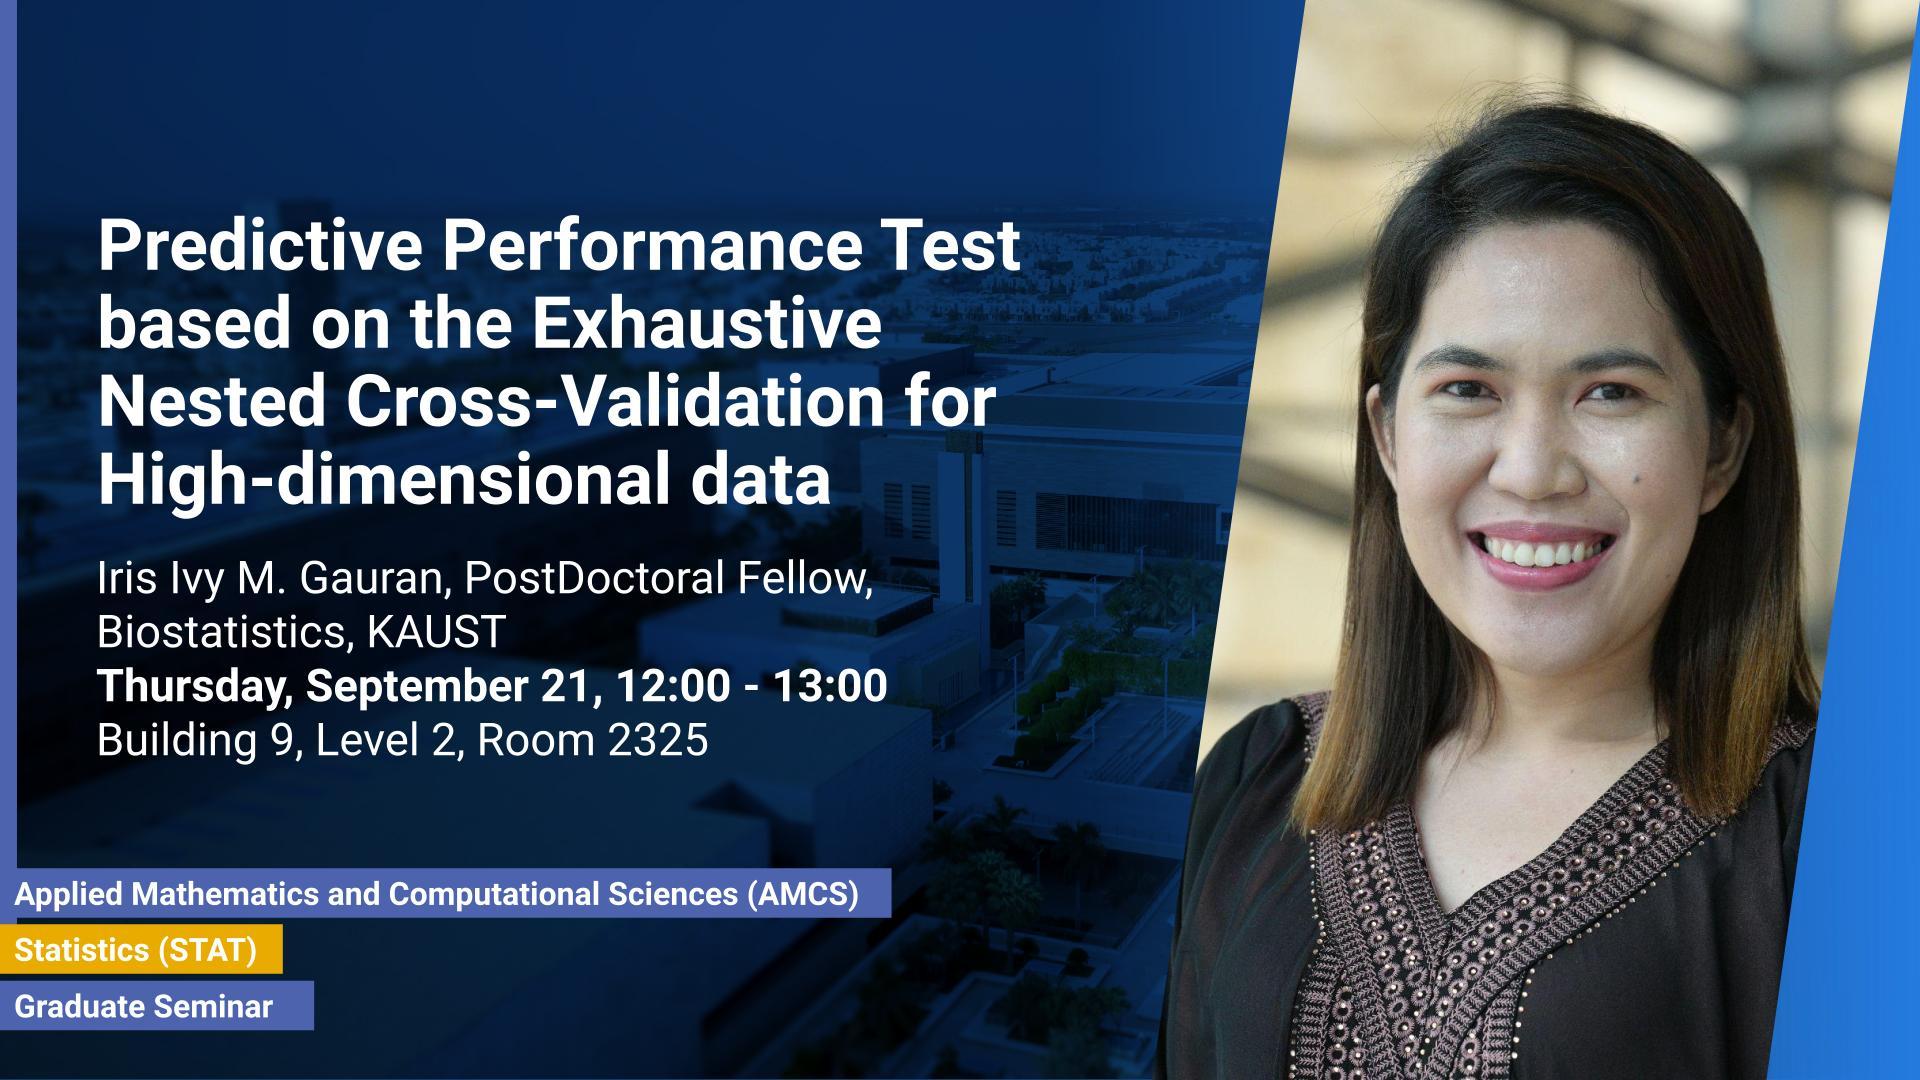
Thursday, September 21, 2023, 12:00
- 13:00
Building 9, Level 2, Room 2325
Contact Person
Cross-validation is an algorithmic technique extensively used for estimating the prediction error, tuning the regularization parameter, and choosing between competing predictive rules.
Thursday, September 14, 2023, 12:00
- 13:00
Building 9, Level 2, Room 2325
Contact Person
Goodness-of-fit tests determine how well a set of observed data fits a particular probability distribution. They can also show if some categorical variable follows a hypothesized family of distributions.
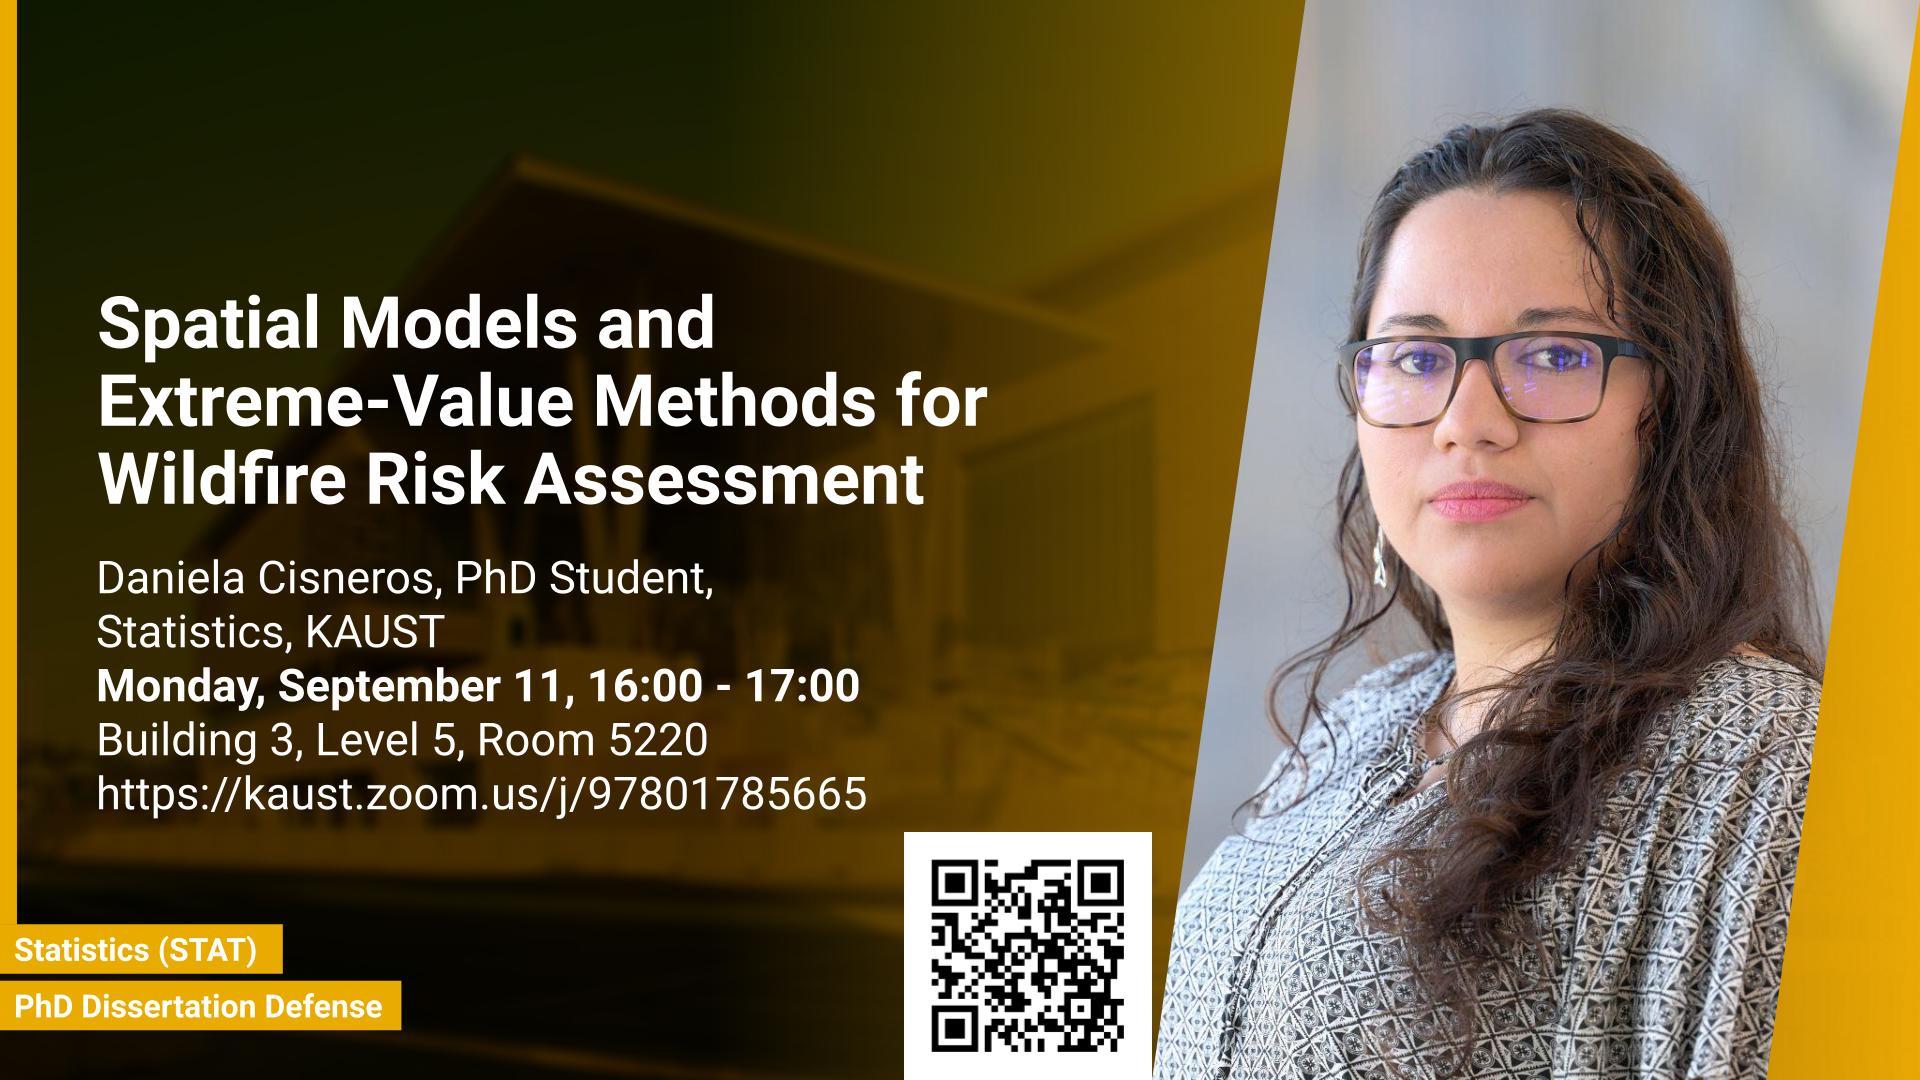
Monday, September 11, 2023, 16:00
- 17:00
B3, L5, R5220
Contact Person
The statistical modeling of spatial and extreme events provides a framework for the development of techniques and models to describe natural phenomena in a variety of environmental, geoscience, and climate science applications. In a changing climate, various natural hazards, such as wildfires, are believed to have evolved in frequency, size, and spatial extent, although regional responses may vary.
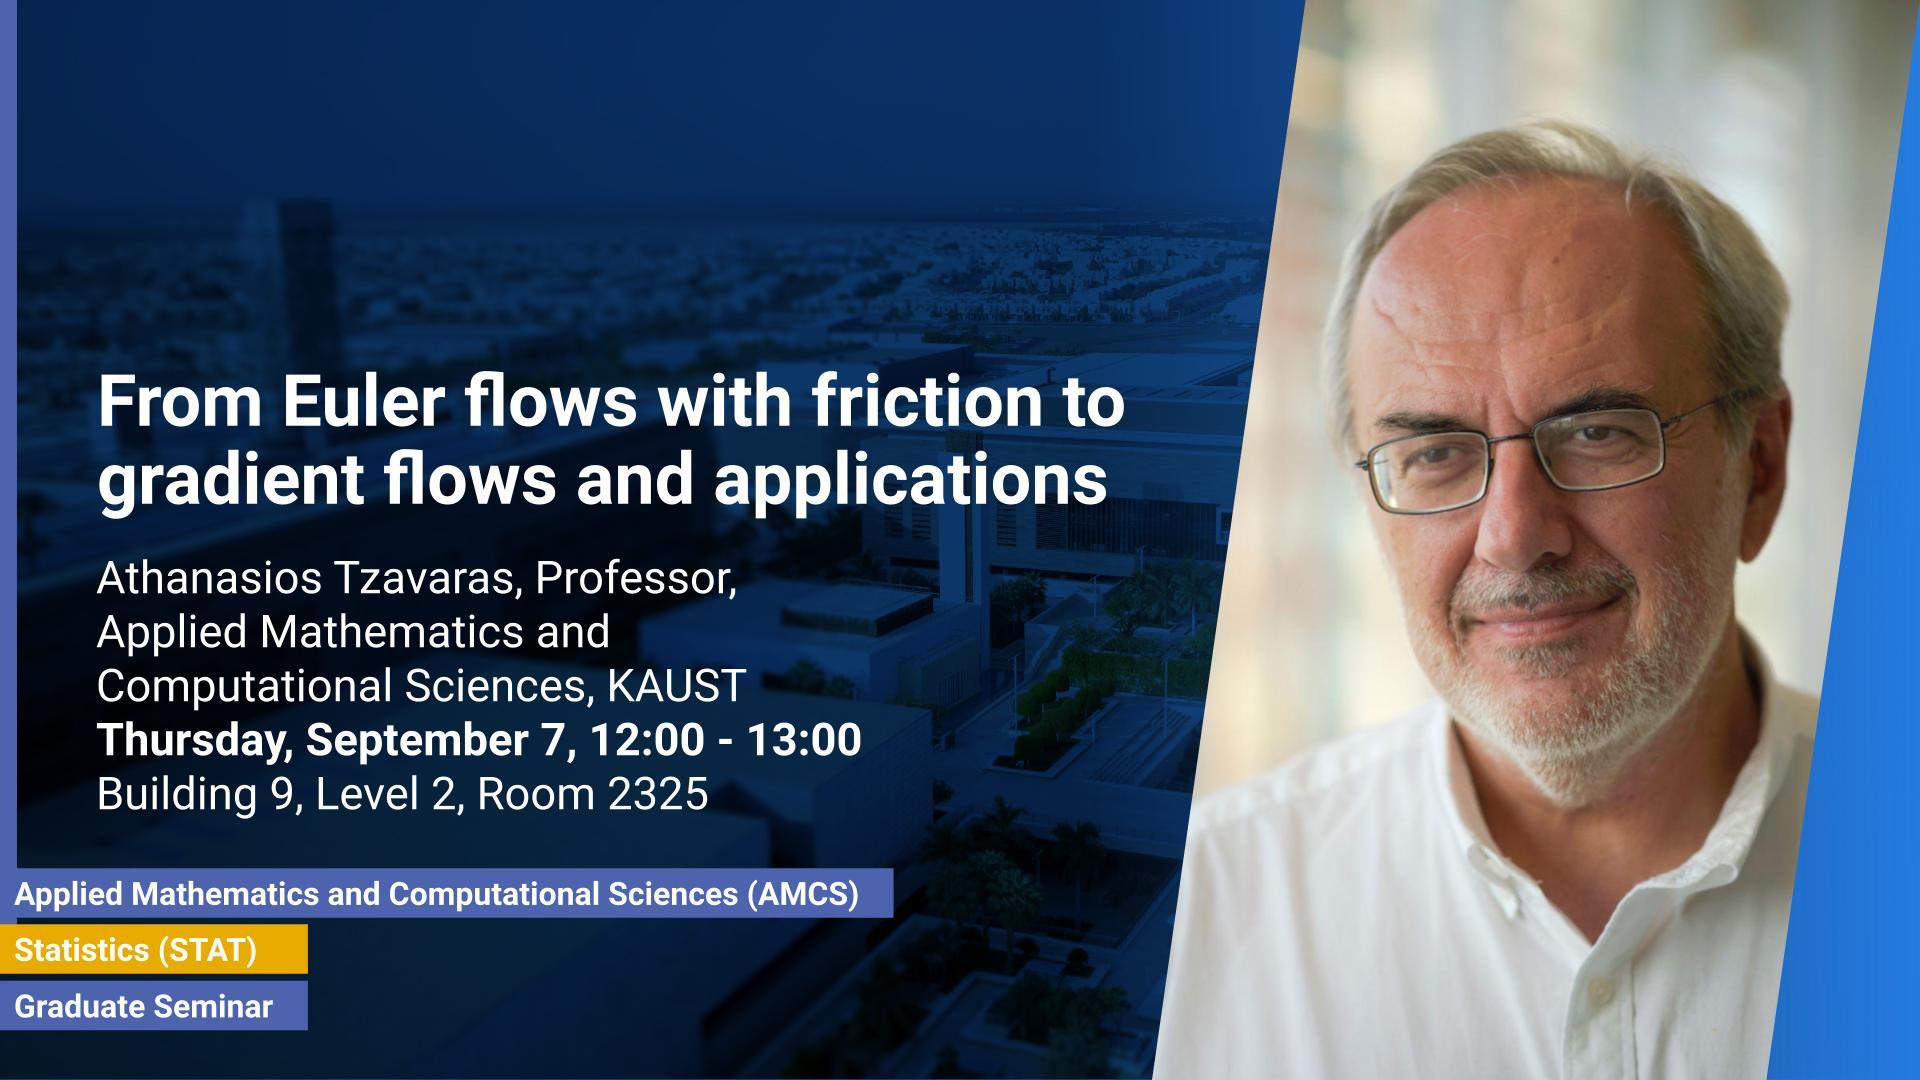
Thursday, September 07, 2023, 12:00
- 13:00
Building 9, Level 2, Room 2325
I will review some works on the high-friction limit (or small mass approximation) from Euler flows to advection-diffusion systems that are gradient flows, and related asymptotic problems in fluid mechanics. The formulation exploits the variational structure of compressible Euler flows and is connected to the interpretation of nonlinear Fokker-Planck systems as gradient flows in Wasserstein distance.
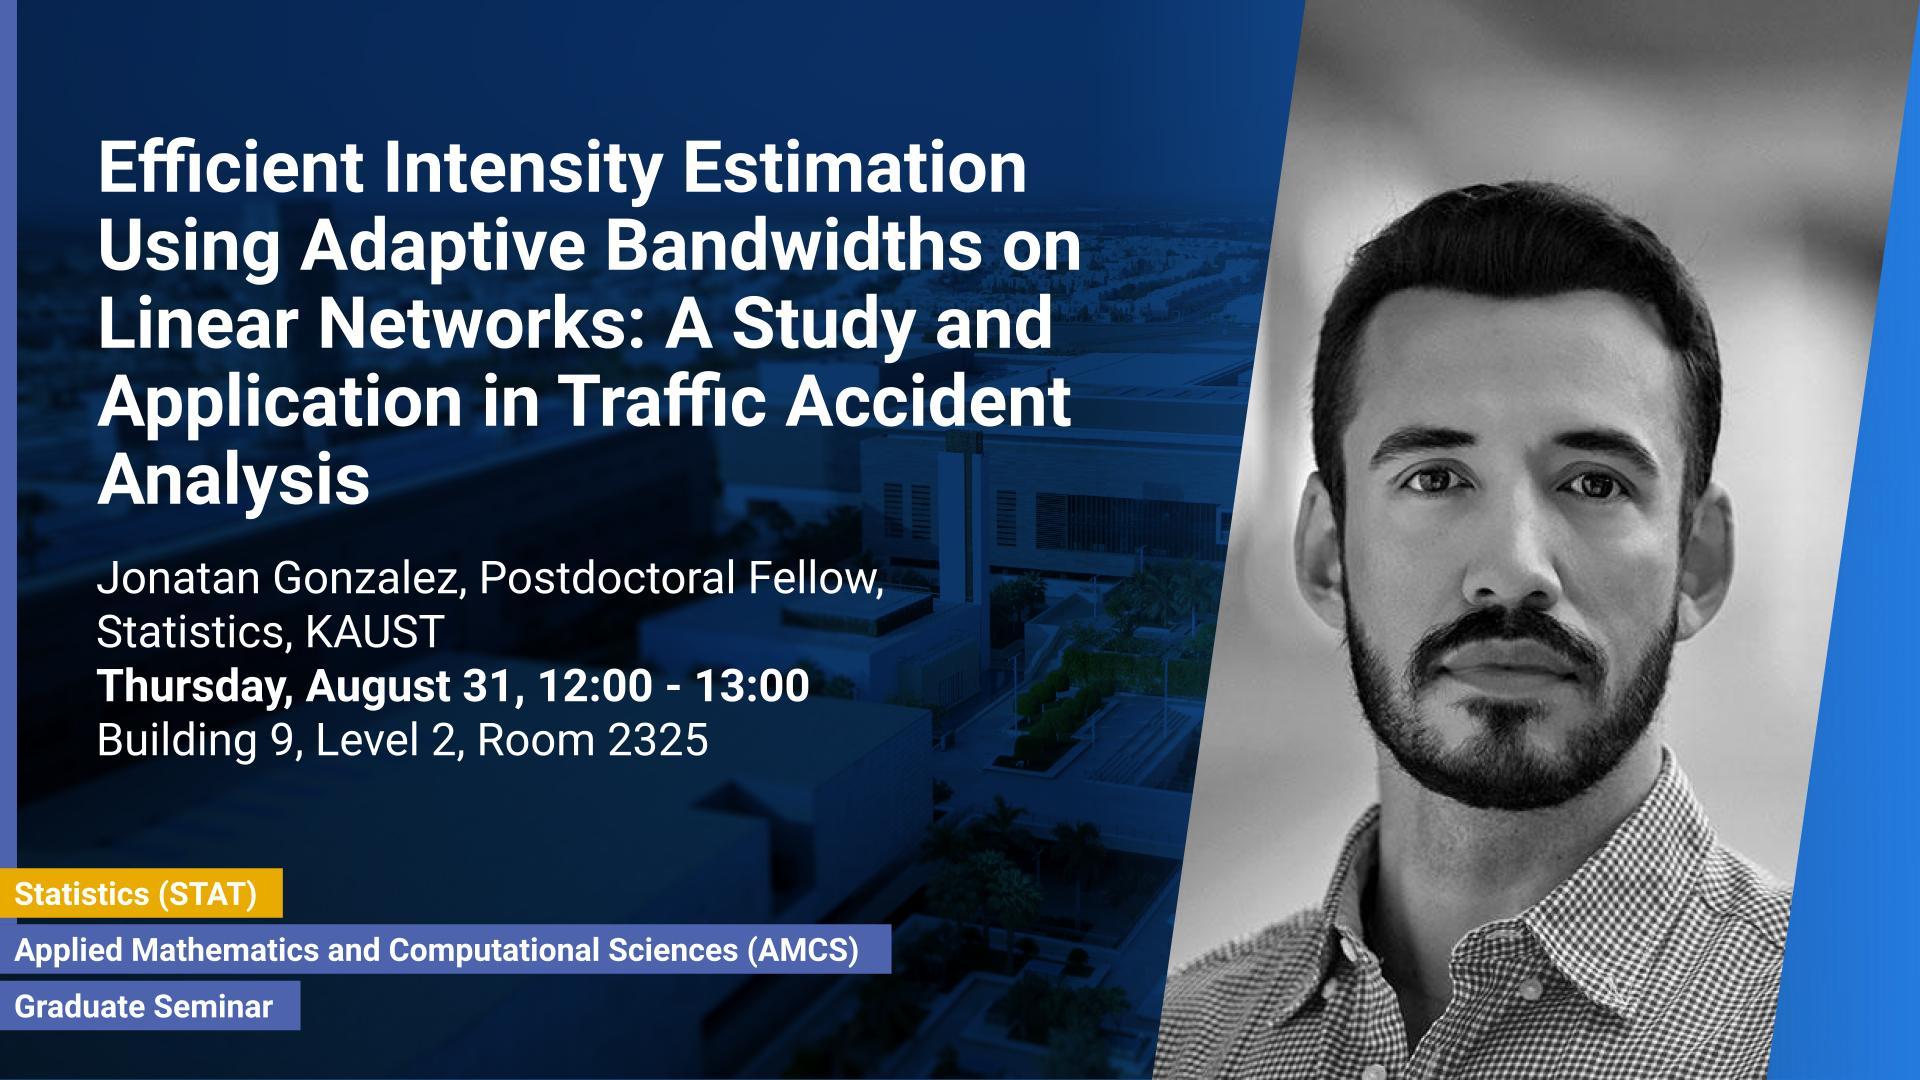
Thursday, August 31, 2023, 12:00
- 13:00
Building 9, Level 2, Room 2325
Contact Person
Estimating first-order intensity functions is crucial in the analysis of point patterns on linear networks, but selecting suitable bandwidths for non-parametric methods remains challenging. We propose an adaptive intensity estimator for the heating kernel that adjusts bandwidths based on data points, a novel approach in this context.
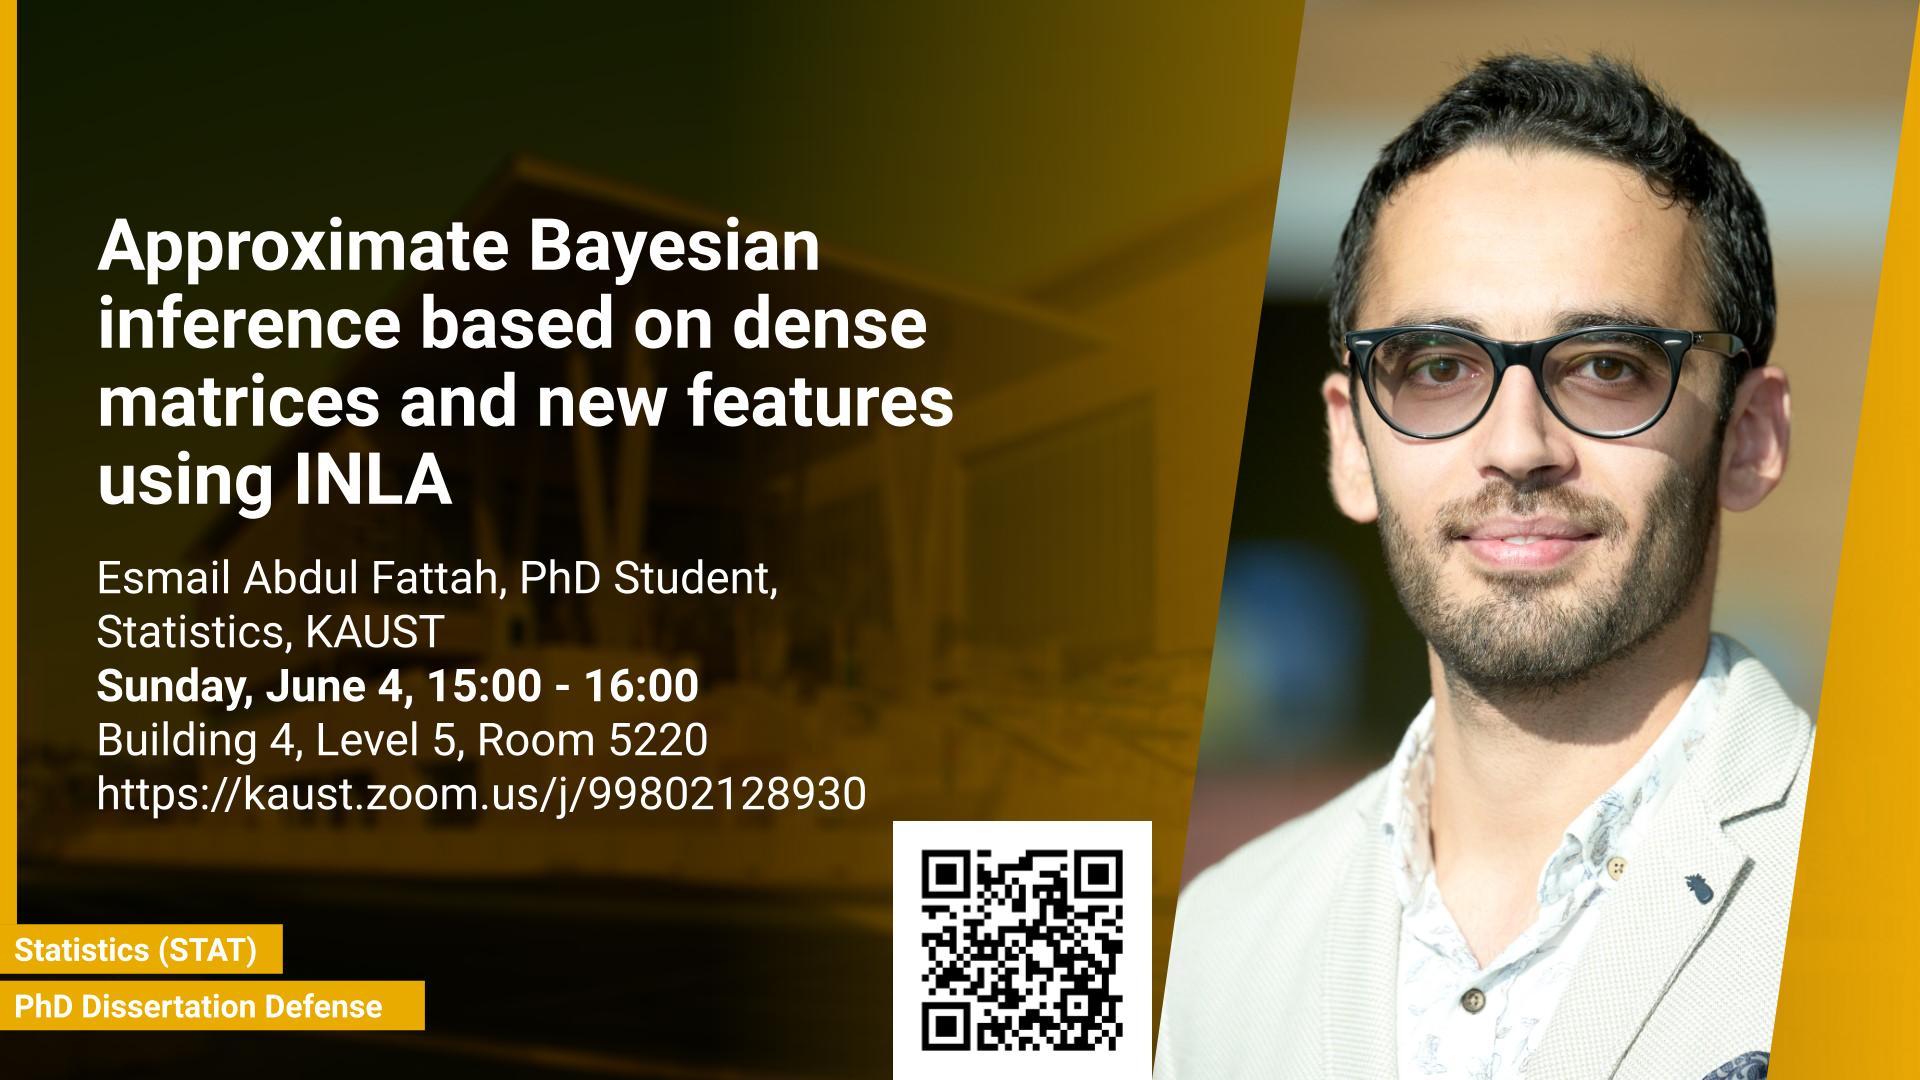
Sunday, June 04, 2023, 15:00
- 16:00
B4, L5, R5220
Contact Person
The Integrated Nested Laplace Approximations (INLA) method has become a commonly used tool for researchers and practitioners to perform approximate Bayesian inference for various fields of applications. It has become essential to incorporate more complex models and expand the method’s capabilities with more features. In this dissertation, we contribute to the INLA method in different aspects.
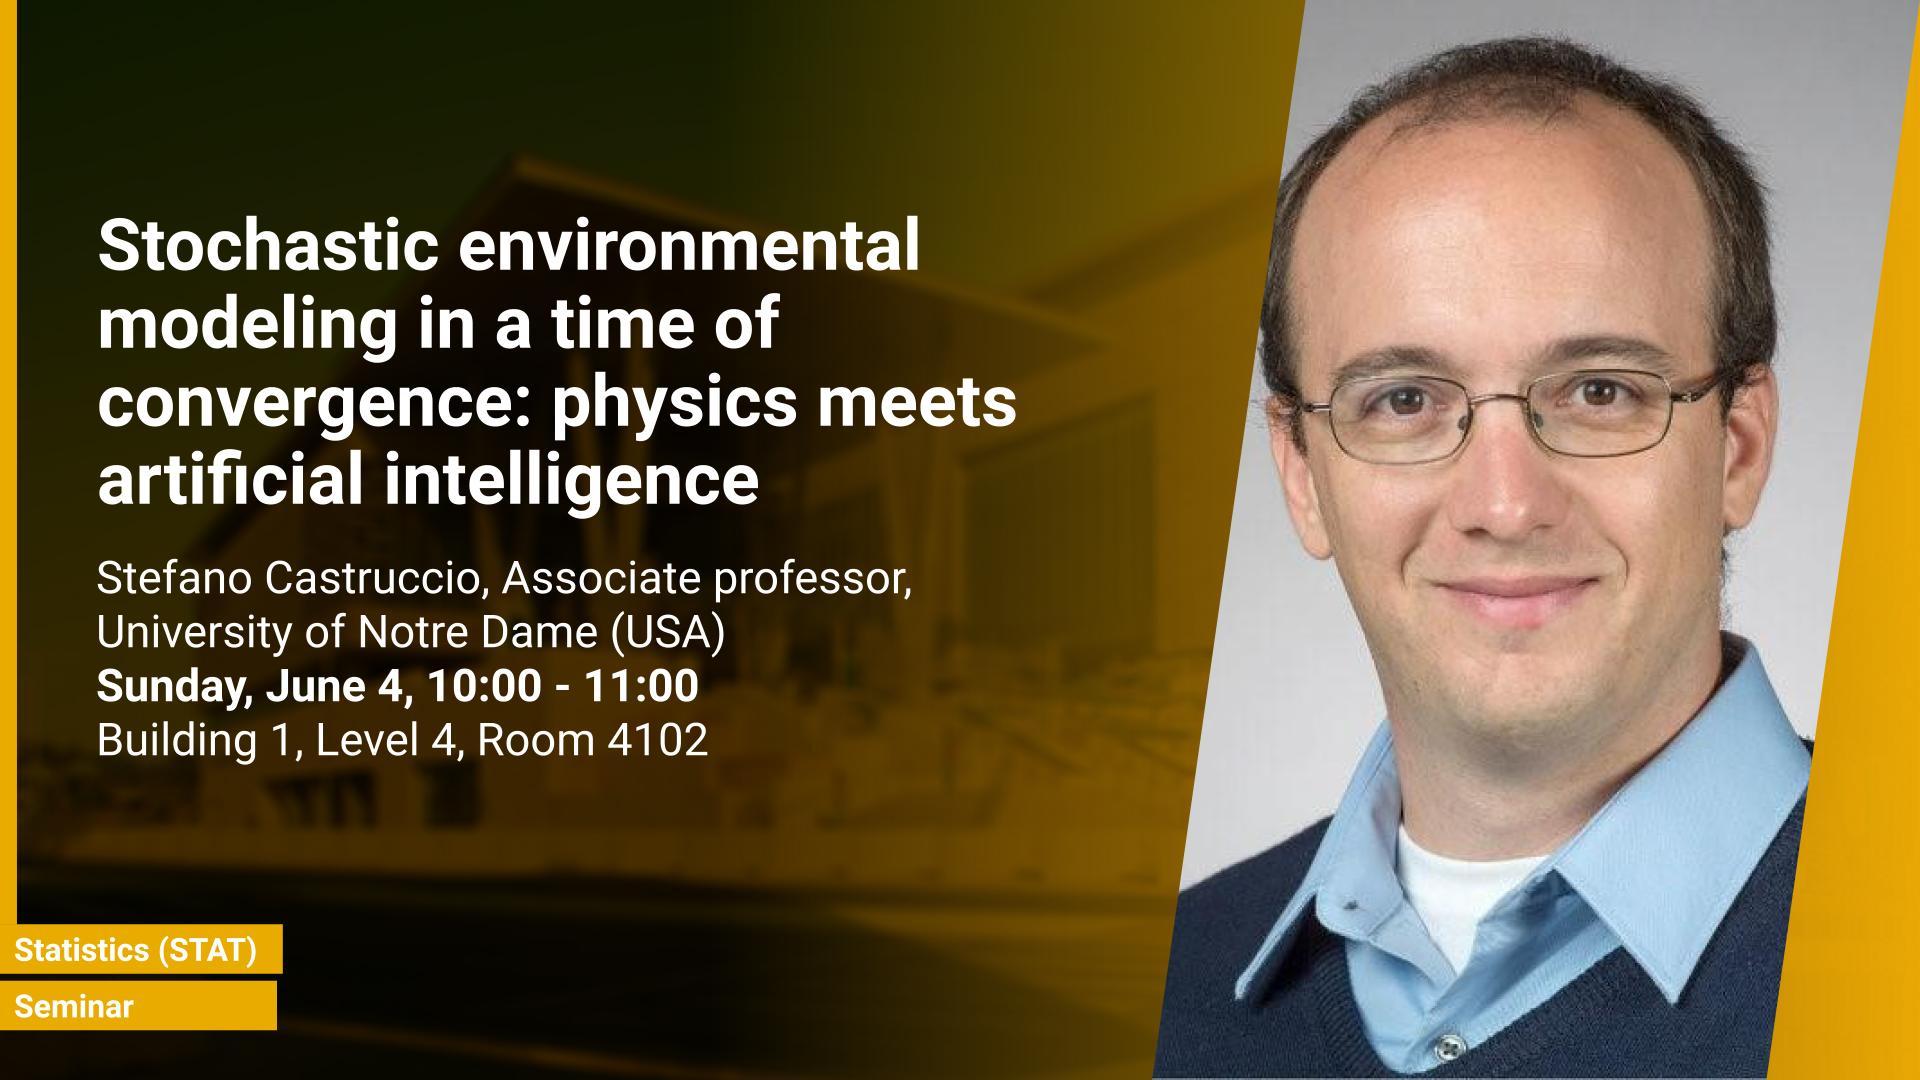
Prof. Stefano Castruccio, Associate professor, University of Notre Dame, USA
Sunday, June 04, 2023, 10:00
- 11:00
Building 1, Level 4, Room 4102
Contact Person
It is widely acknowledged how the relentless surge of Volume, Velocity and Variety of data, as well as the simultaneous increase of computational resources have stimulated the development of data-driven methods with unprecedented flexibility and predictive power. However, not every environmental study entails a large data set: many applications ranging from astronomy or paleo-climatology have a high associated sampling cost and are instead constrained by physics-informed partial differential equations. Throughout the past few years, a new and powerful paradigm has emerged in the machine learning literature, merging data-driven and physics-informed problems, hence providing a unified framework for a whole spectrum of problems ranging from data-rich/context-poor to data-poor/context-rich. In this talk, I will present this new framework and discuss some of the most recent efforts to reformulate it as a stochastic model-based approach, thereby allowing calibrated uncertainty quantification.
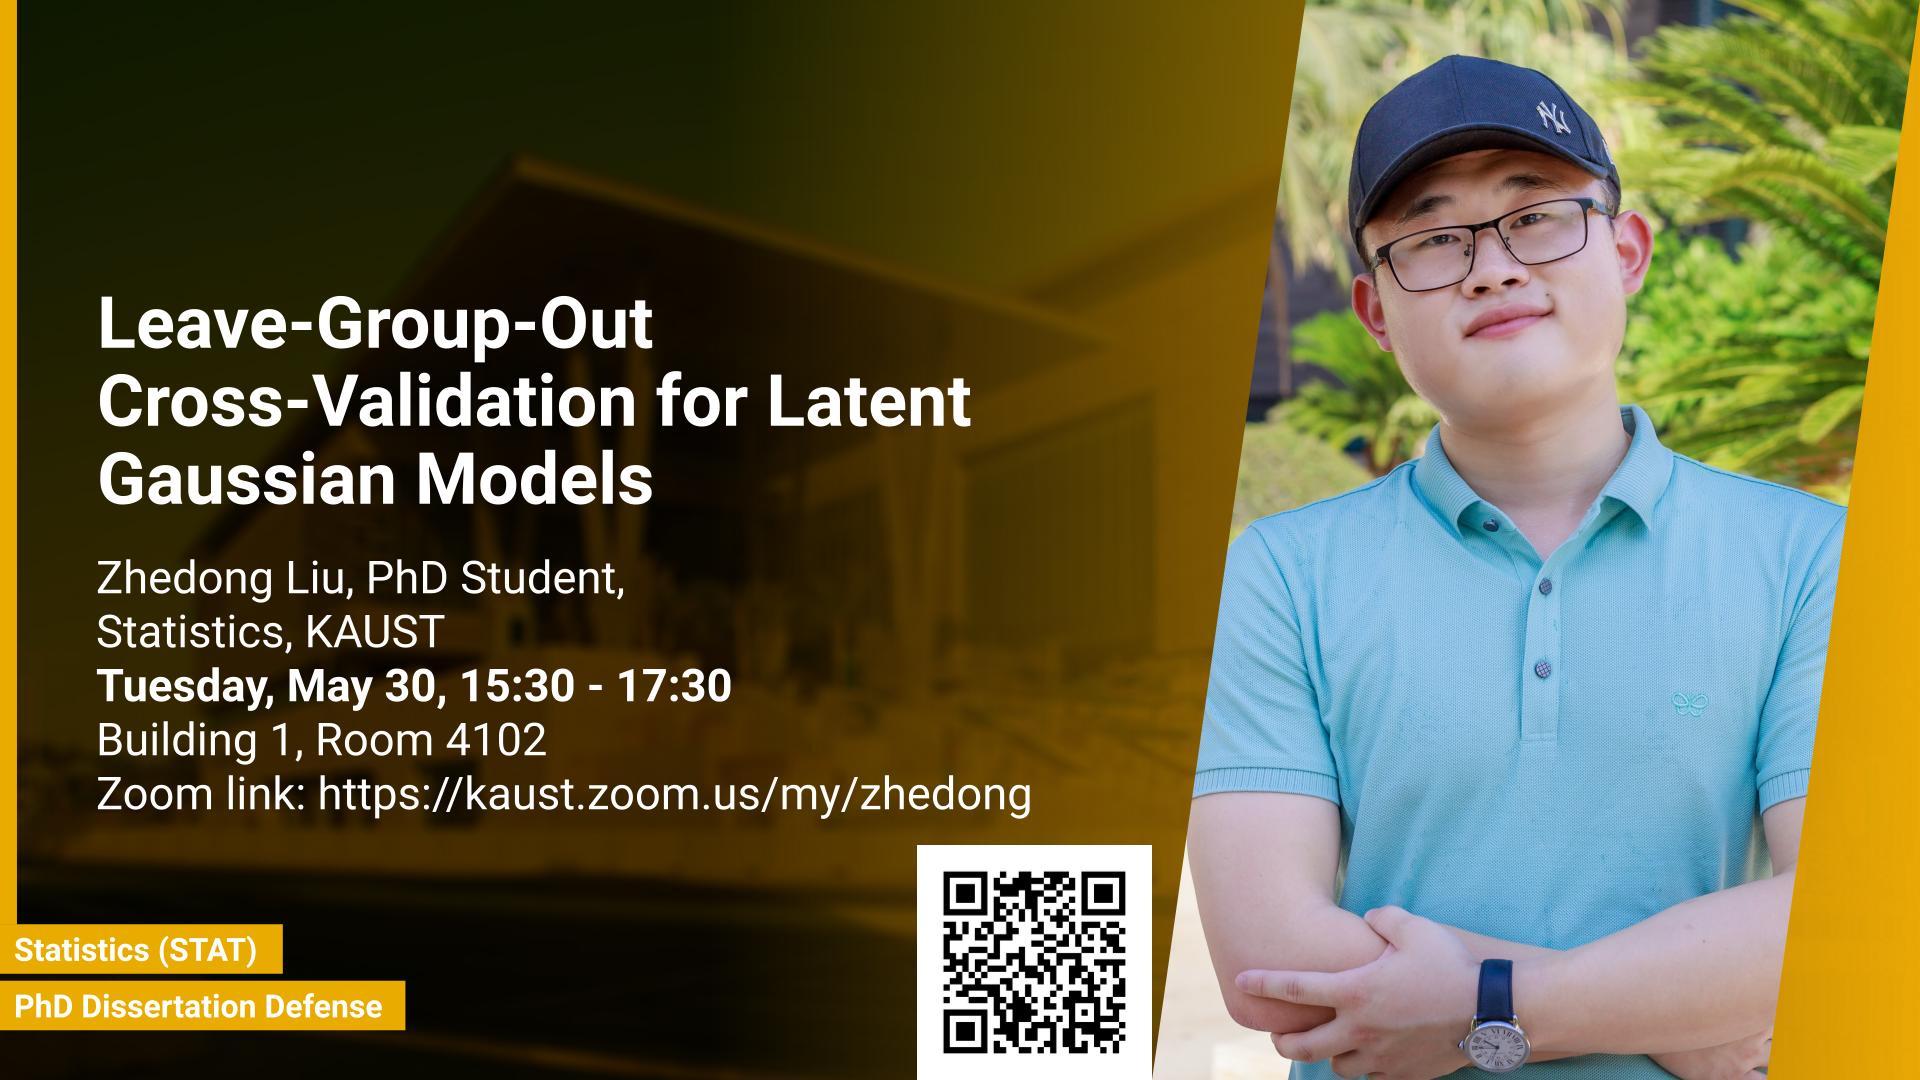
Tuesday, May 30, 2023, 15:30
- 17:30
B1, R4102;
Contact Person
The commonly used leave-one-out and K-fold cross-validation methods are not suitable for structured models with multiple prediction tasks. To overcome this limitation, we introduce leave-group-out cross-validation, which allows groups to adapt to different tasks. We propose an automatic group construction method and provide an efficient approximation for latent Gaussian models. Moreover, this method is conveniently implemented in the R-INLA software.
Sunday, May 28, 2023, 15:00
- 16:00
B1, L4, R4102
Contact Person
Latent Gaussian models (LGM) are widely used but struggle with certain datasets that contain non-Gaussian features, such as sudden jumps or spikes. This dissertation aims to provide tools for researchers to check the adequacy of the fitted LGM (criticism); if the check fails, offer efficient and user-friendly implementations of latent non-Gaussian models, which lead to more robust inferences (robustification).
Peter Rousseeuw, Professor Emeritus, Statistics and Data Science, KU Leuven, Belgium
Tuesday, May 09, 2023, 15:00
- 16:00
Building 9, Level 2, Room 2325
Contact Person
Classification is a major tool of statistics and machine learning. Several classifiers have interesting visualizations of their inner workings. Here we pursue a different goal, which is to visualize the cases being classified, either in training data or in test data. An important aspect is whether a case has been classified to its given class (label) or whether the classifier wants to assign it to a different class. This is reflected in the probability of the alternative class (PAC). A high PAC indicates label bias, i.e. the possibility that the case was mislabeled. The PAC is used to construct a silhouette plot which is similar in spirit to the silhouette plot for cluster analysis. The average silhouette width can be used to compare different classifications of the same dataset. We will also draw quasi residual plots of the PAC versus a data feature, which may lead to more insight in the data. One of these data features is how far each case lies from its given class, yielding so-called class maps. The proposed displays are constructed for discriminant analysis, k-nearest neighbors, support vector machines, CART, random forests, and neural networks. The graphical displays are illustrated and interpreted on data sets containing images, mixed features, and texts.
Peter Rousseeuw, Professor Emeritus, Statistics and Data Science, KU Leuven, Belgium
Tuesday, May 09, 2023, 12:00
- 13:00
Building 9, Level 2, Room 2325
Contact Person
A multivariate dataset consists of n cases in d dimensions, and is often stored in an n by d data matrix. It is well-known that real data may contain outliers. Depending on the situation, outliers may be (a) undesirable errors which can adversely affect the data analysis, or (b) valuable nuggets of unexpected information. In statistics and data analysis the word outlier usually refers to a row of the data matrix, and the methods to detect such outliers only work when at least half the rows are clean. But often many rows have a few contaminated cell values, which may not be visible by looking at each variable (column) separately. We describe a method to detect deviating data cells in a multivariate sample which takes the correlations between the variables into account. It has no restriction on the number of clean rows, and can deal with high dimensions. Other advantages are that it provides predicted values of the outlying cells, while imputing missing values at the same time. We illustrate the method on several real data sets, where it uncovers more structure than found by purely columnwise methods or purely rowwise methods. The proposed method can help to diagnose why a certain row is outlying, e.g. in process control. It also serves as an initial step for estimating multivariate location and scatter matrices, and for cellwise robust principal component analysis.
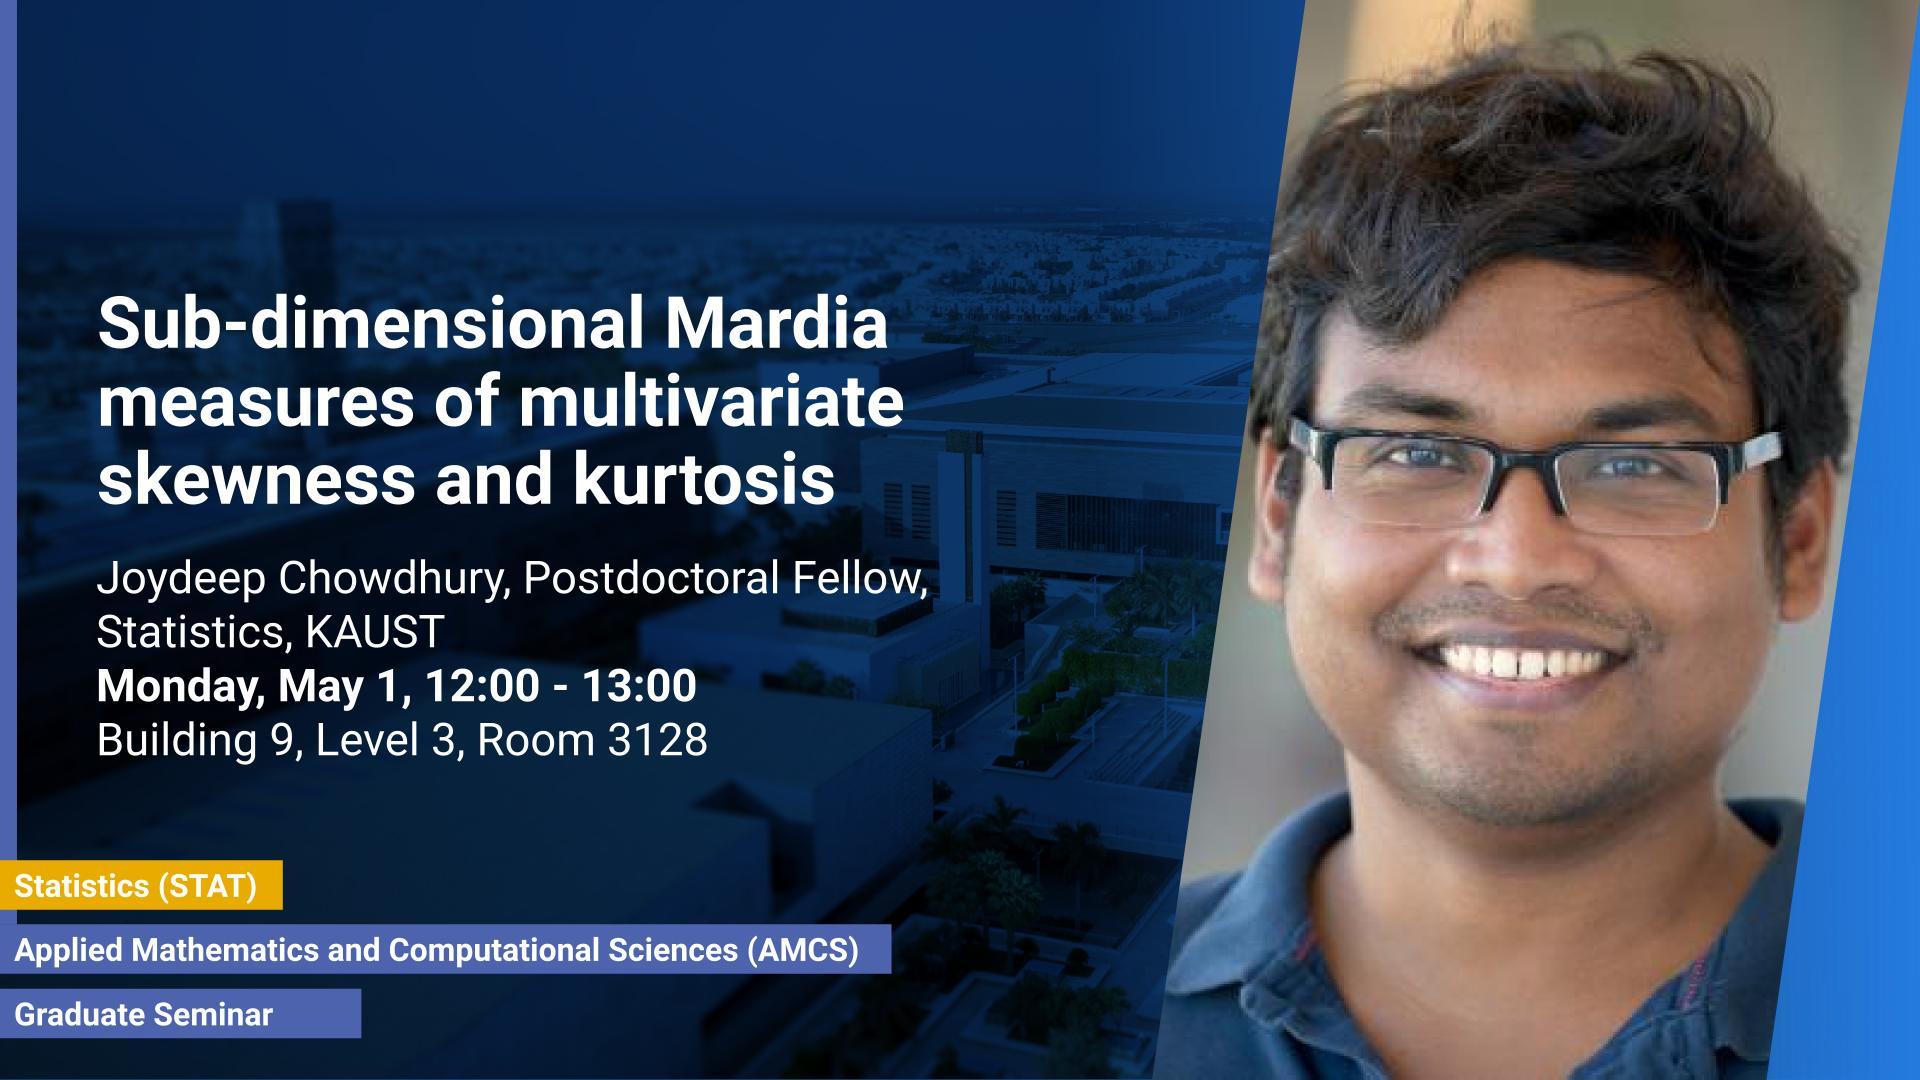
Monday, May 01, 2023, 12:00
- 13:00
Building 9, Level 3, Room 3128
The Mardia measures of multivariate skewness and kurtosis summarize the respective characteristics of a multivariate distribution with two numbers. However, these measures do not reflect the sub-dimensional features of the distribution. Consequently, testing procedures based on these measures may fail to detect skewness or kurtosis present in a sub-dimension of the multivariate distribution. We introduce sub-dimensional Mardia measures of multivariate skewness and kurtosis, and investigate the information they convey about all sub-dimensional distributions of some symmetric and skewed families of multivariate distributions.
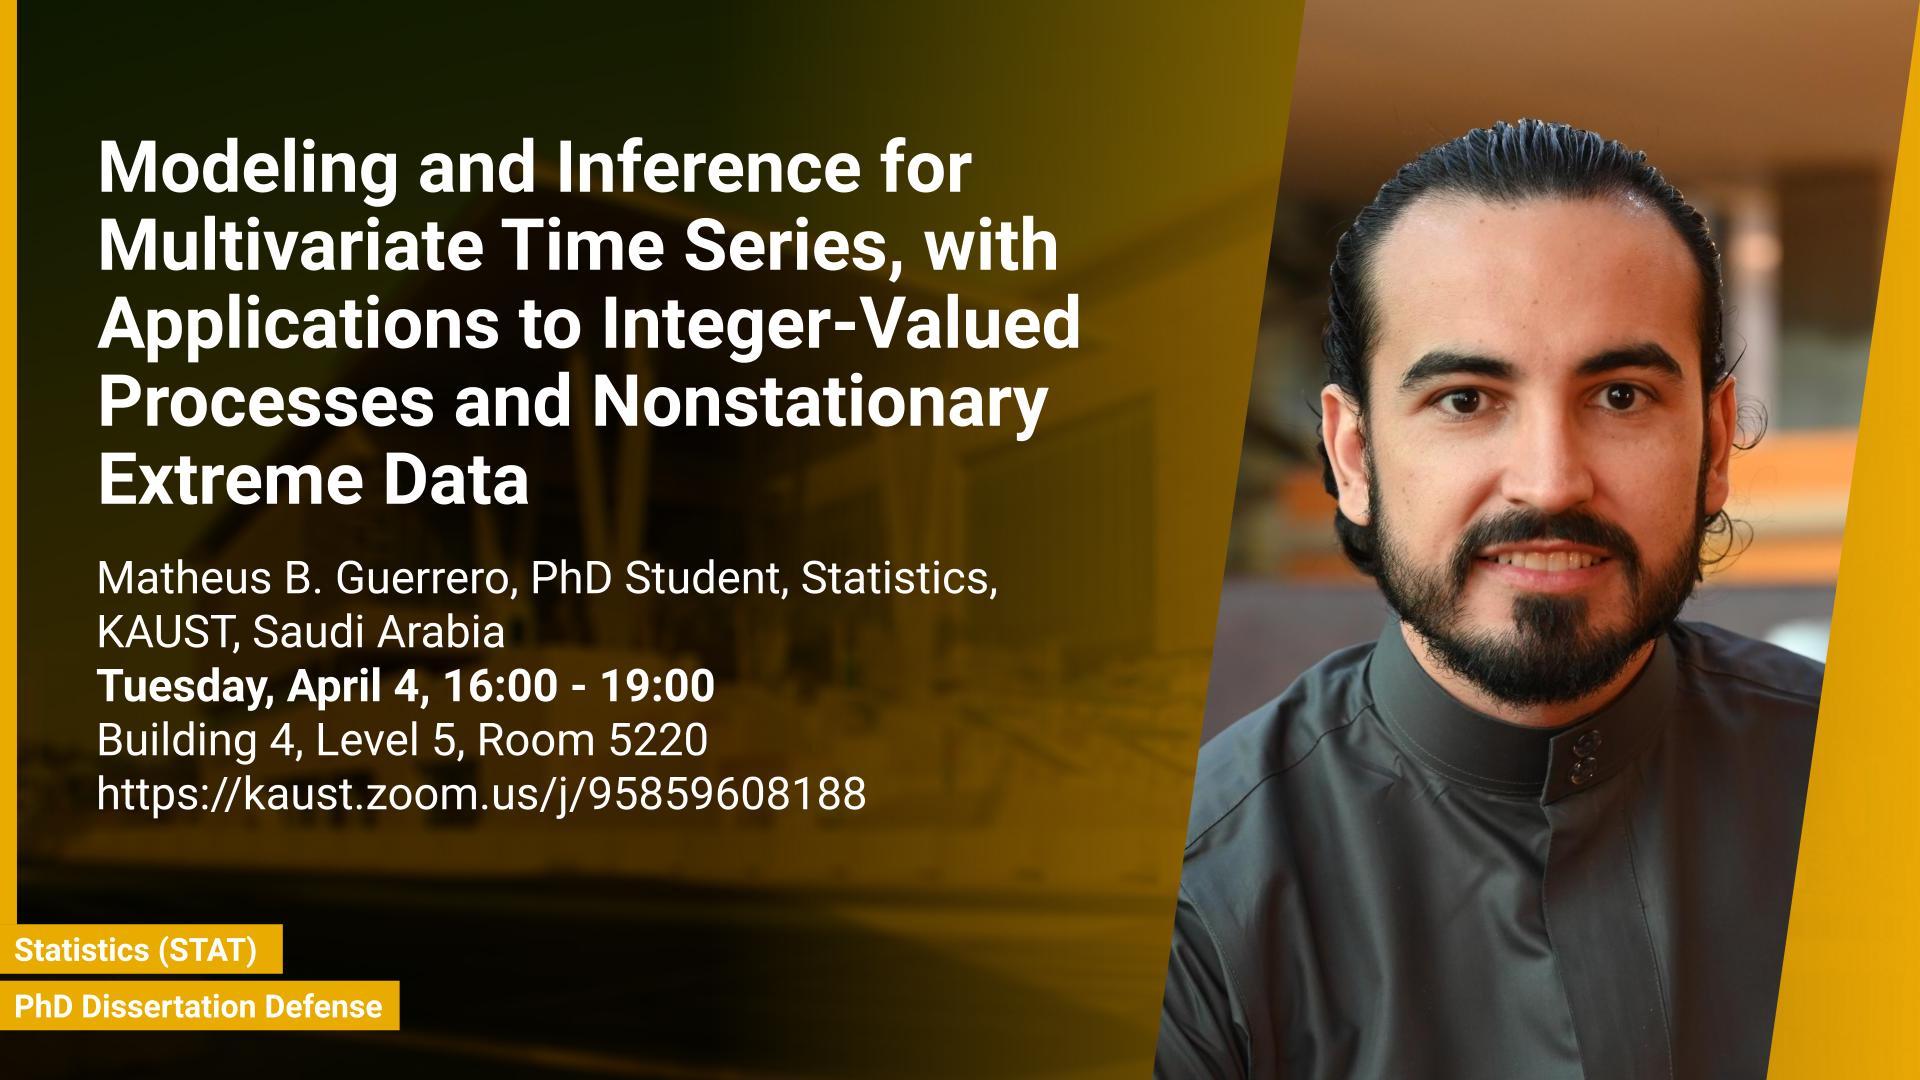
Tuesday, April 04, 2023, 16:00
- 19:00
B4, L5, R5220
Contact Person
This Ph.D. research focuses on proposing new statistical methods for two types of time series data: integer-valued data and multivariate nonstationary extreme data. For the former, the researcher proposes a novel approach to building an integer-valued autoregressive (INAR) model that offers the flexibility to specify both marginal and innovation distributions, leading to several new INAR processes. For the latter, the researcher proposes new extreme value theory methods for analyzing multivariate nonstationary extreme data, specifically EEG recordings from patients with epilepsy. Two extreme-value methods, Conex-Connect and Club Exco, are proposed to study alterations in the brain network during extreme events such as epileptic seizures.
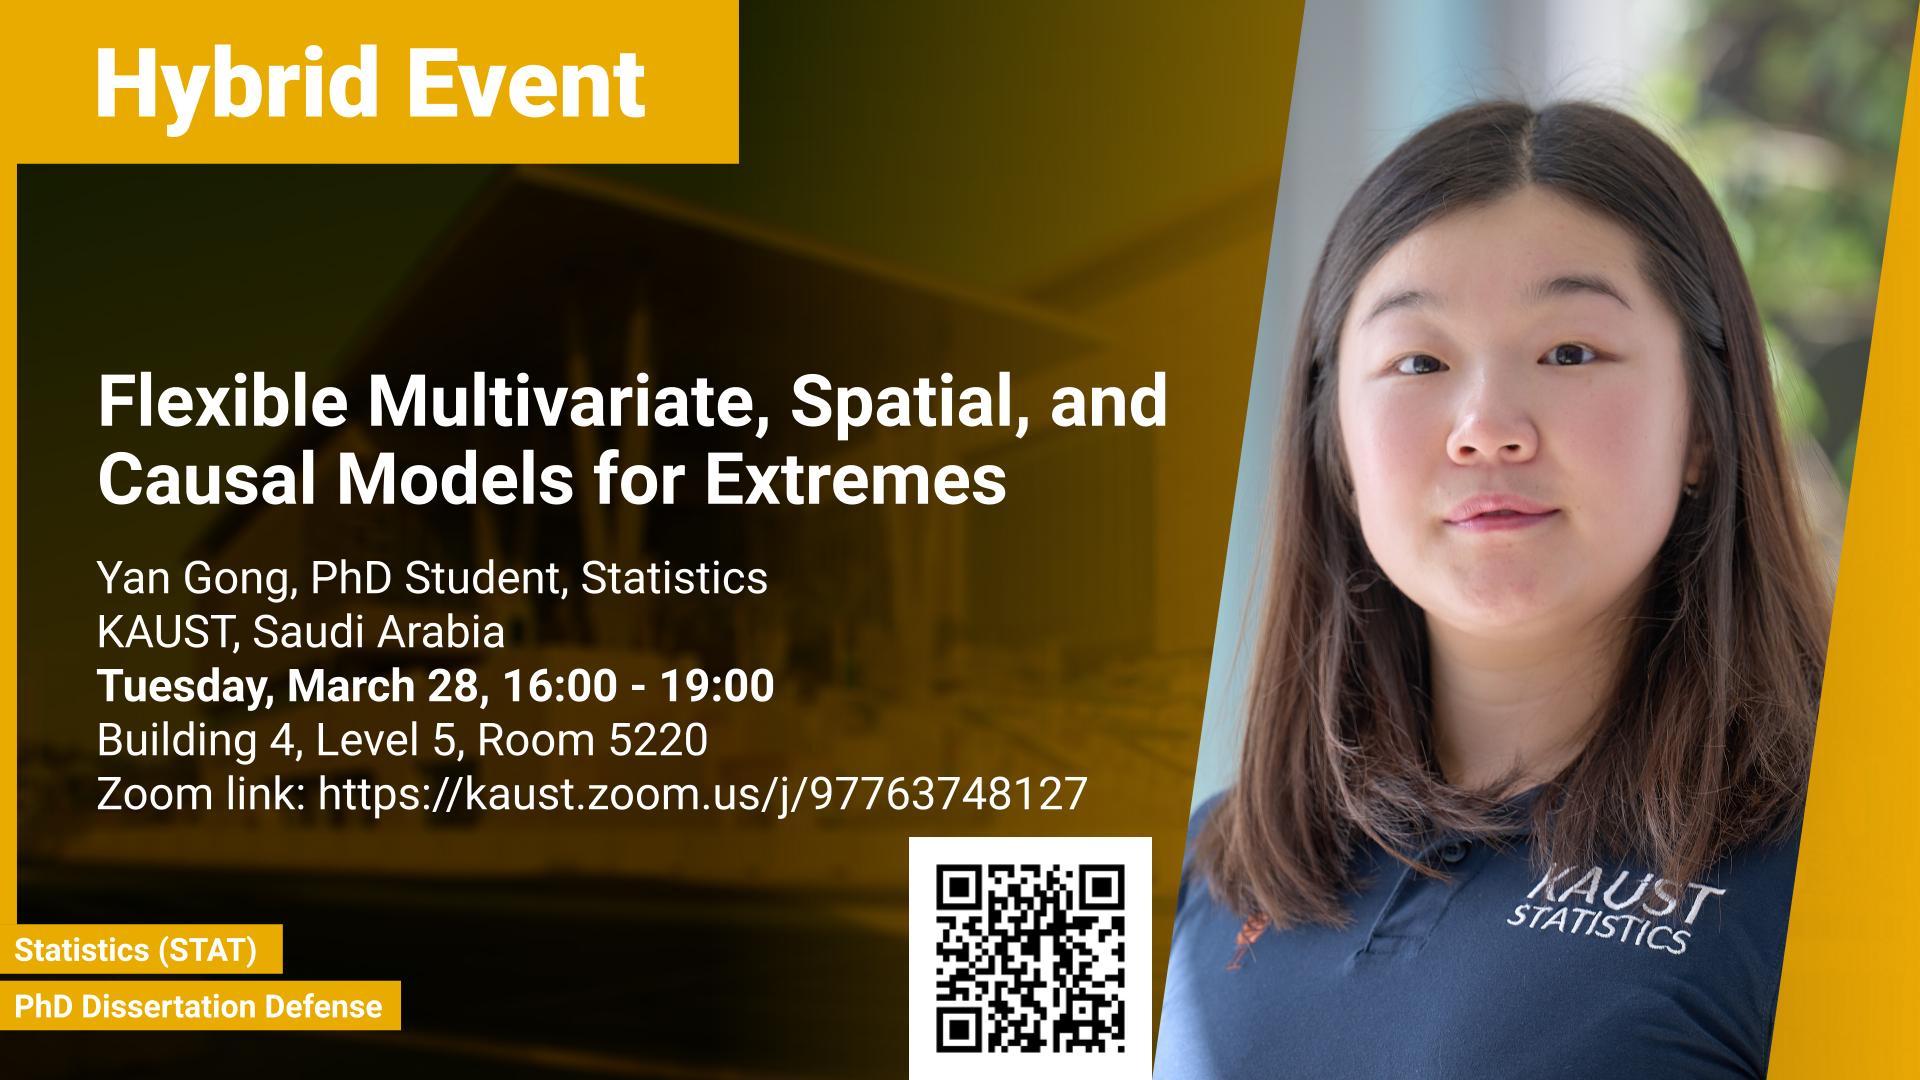
Tuesday, March 28, 2023, 16:00
- 19:00
B4, L5, R5220
Contact Person
Risk assessment for natural hazards and financial extreme events requires the statistical analysis of extreme events, often beyond observed levels. The characterization and extrapolation of the probability of rare events rely on assumptions about the extremal dependence type and about the specific structure of statistical models. In this thesis, we develop models with flexible tail dependence structures, in order to provide a reliable estimation of tail characteristics and risk measures. Our novel methodologies are illustrated by a range of applications to financial, climatic, and health data.
Prof. Victor DeOliveira, Professor in Department of Management Science and Statistics in the Carlos Alvarez College of Business
Wednesday, March 15, 2023, 15:00
- 16:00
Building 1, Level 4, Room 4102
Contact Person
The Mat\'ern family of covariance functions is currently the most commonly used for the analysis of geostatistical data due to its ability to describe different smoothness behaviors. Yet, in many applications the smoothness parameter is set at an arbitrary value.