Honing in on hotspots in spatial data
More accurate detection of hotspot clusters provides new insights into the behavior of air pollution.
About
A more reliable method for identifying regions with different relationships between air pollution and weather conditions improves the detection of pollution hotspots.
The relationship between weather conditions and air pollution is complex and can vary wildly from location to location. This makes it difficult to pinpoint the sources of pollution and predict its behavior in the atmosphere. While data scientists and statisticians have made significant progress in wrestling with this problem, the enormous volumes of environmental data and multitude of variables, such as wind speed, temperature and pollution component, require compromises to make the problem manageable.
For example, most existing approaches to detecting "hotspots" in the correlation between variables in spatial data involve constructing a grid in which the relationship between variables in a cell is treated independently of all others. Although this is not entirely realistic—there is often dependence between spatial areas particularly in weather and air pollution data—it is extraordinarily difficult to find spatial hotspots and determine the spatial dependence structure at the same time.
Ying Sun and Junho Lee from KAUST’s Environmental Statistics Laboratory have made a leap forward in addressing this problem with the development of a "mixed effect model" for hotspot detection.
“We address the problem by using a simple spatial block structure to approximate the spatial dependency,” says Lee. “This allows us to find spatial hotspots showing distinct patterns while reducing the rate of false positives due to spatial dependence.”
The approach, developed in collaboration with Howard Chang from Emory University in the United States, involves breaking the region into blocks and sequentially applying random effects to the blocks to tease out strong correlations from background variability or "noise." This has the added benefit of being able to identify any number of hotspot clusters in the data, including clusters that may overlap.
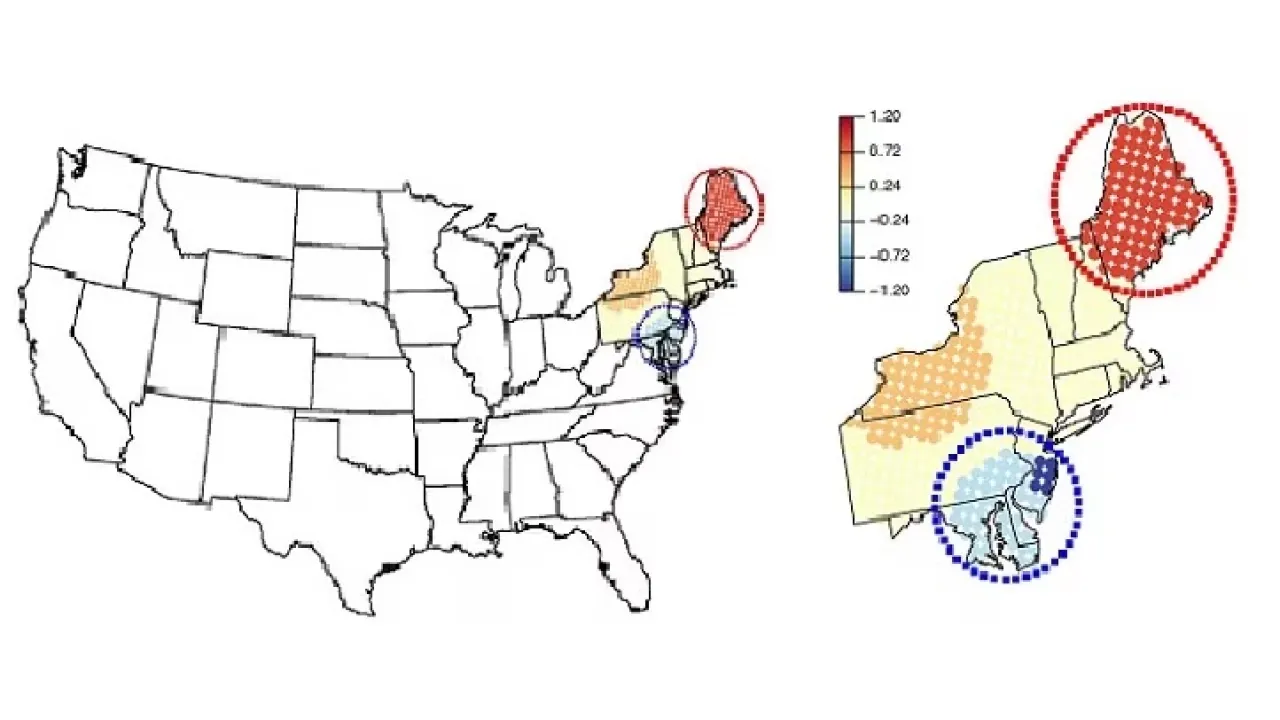
This map shows how the mixed effect model breaks the northeastern U.S. into blocks, allowing them to identify "hotspots."
Reproduced with permission from reference one © 2019 John Wiley & Sons Ltd
“The main challenge was how to decide an appropriate block size for the random effects,” says Lee. “We settled on matching the block size to the range of spatial dependence in the data.”
Read the full article
Related People
Related Researchers

Junho Lee
- Postdoctoral Research Fellow, Statistics