Visualizing a real change: CEMSE-held exhibition "State of Flux" opens new frontiers in information visualization for science
Climate change is affecting the world drastically. Contrasting perceptions look at it as either a direct effect of human carelessness or a natural calamity. Whatever the case, prompting action for preventing or mitigating its effects lies on effective and easy-to-understand communication.
About
-By Valentina De Vincenti
Climate change is affecting the world drastically. Contrasting perceptions look at it as either a direct effect of human carelessness or a natural calamity. Whatever the case, prompting action for preventing or mitigating its effects lies on effective and easy-to-understand communication.
An innovative approach to the visualization of scientific research was presented by Natacha Poggio, Professor of Graphic Design at Lamar University (Texas, United States), and one of the speakers at the latest edition of the 2017 KAUST-NSF Research Conference on Interactive Electronics for a Sustainable Future.
Organized by the Computer, Electrical and Mathematical Sciences and Engineering (CEMSE) Division, and co-sponsored by the National Science Foundation (NSF), the conference gathered the best scientific ideas to create a truly connected world for effective solutions to global challenges.
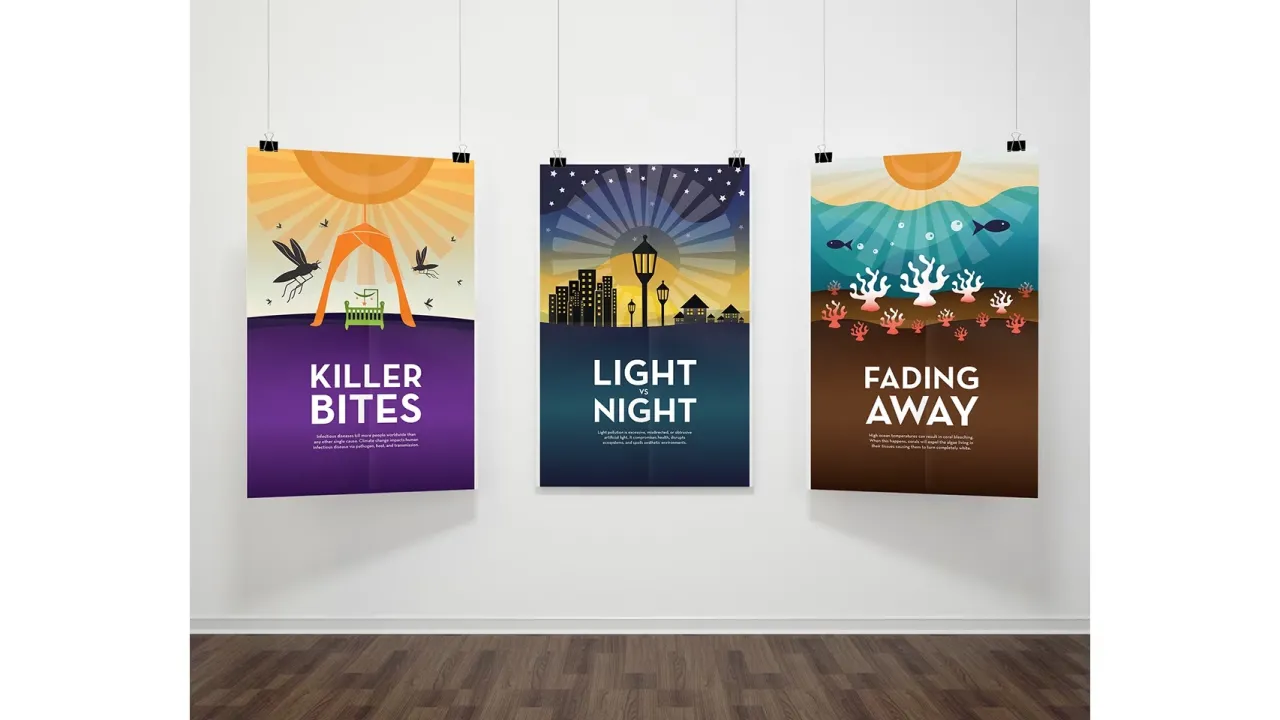
Poggio curated State of Flux - a gallery of 39 eye-opening educational posters on climate change authored by her students using graphic design to highlight environmental and social aspects of climate change.
"There is an evident interest in scientific research communication to the general public. These posters are communicating effectively these topics because they were produced via a process of synthesis. In general, audiences prefer simple, yet impactful messages. The posters have been very well received by conference attendees who found them humoristic in the designs as well as informative," Poggio stressed.
Information visualization is a powerful educational tool to bring scientific research out of labs, according to Poggio. Sometimes simple pictograms could be more effective in conveying a complex message than sophisticated computer renderings. Visual representation greatly helps process and synthesize information, switch on solutions and offer a new point of view, perhaps not present in the original problem. It also conveys conceptual relationships through spatial links or highlights consequential points in time. State of Flux is the vivid example of such graphic approach.
Lamar University's Graphic Design students identified and visualized six issues of interest from NASA's Image of Change website. Launched in 2010, this website shows satellite photos of natural and human environments affected by climate change over different time periods - ranging from centuries to days.
State of Flux is a gallery of visually impactful posters designed to awake awareness. Covering topics such as ocean pollution, forest devastation and soil erosion, but also light pollution, flooding, and acid rain, the posters combine cutting-edge design with pivotal research on the topic. Key figures are graphically portrayed to trigger awareness. Some of these artworks can be seen at designawaken.
Poggio is not new to using visualization for social and environmental campaigns. She built her career working on multi-disciplinary initiatives with engineers and scientists spanning from the United States to developing countries and producing collaborative projects such as the Design Global Change, which developed projects aimed to educate communities on clean water and gender equality in India.
Questioned about her experience at KAUST and future projects, Poggio said: "I hope to collaborate with KAUST faculty in the future. I found it very inspiring talking with various researchers about visualization of scientific information. I would love to collaborate with different faculties on communicating their research visually. What impressed me at KAUST was the research conducted on coral reefs along the coast of the Red Sea. It is a collective responsibility to raise awareness on the impact that climate change will have on these fragile ecosystems."