Figure adapted from that originally published in Ref 1© 2015 Frontiers Media.
A data analysis method to explore the signals from the brain generated by electroencephalograph (EEG) recordings has been developed by researchers from KAUST.
“We hope to gain a better understanding of neuronal activity in the brain,” said Professor Ying Sun from the Computer, Electrical and Mathematical Science & Engineering Division at KAUST.
Sun and her KAUST colleague Professor Marc Genton and co-workers led by Professor Hernando Ombao from the University of California, Irvine (UCI) believe their method may help clinicians detect and monitor conditions such as strokes.
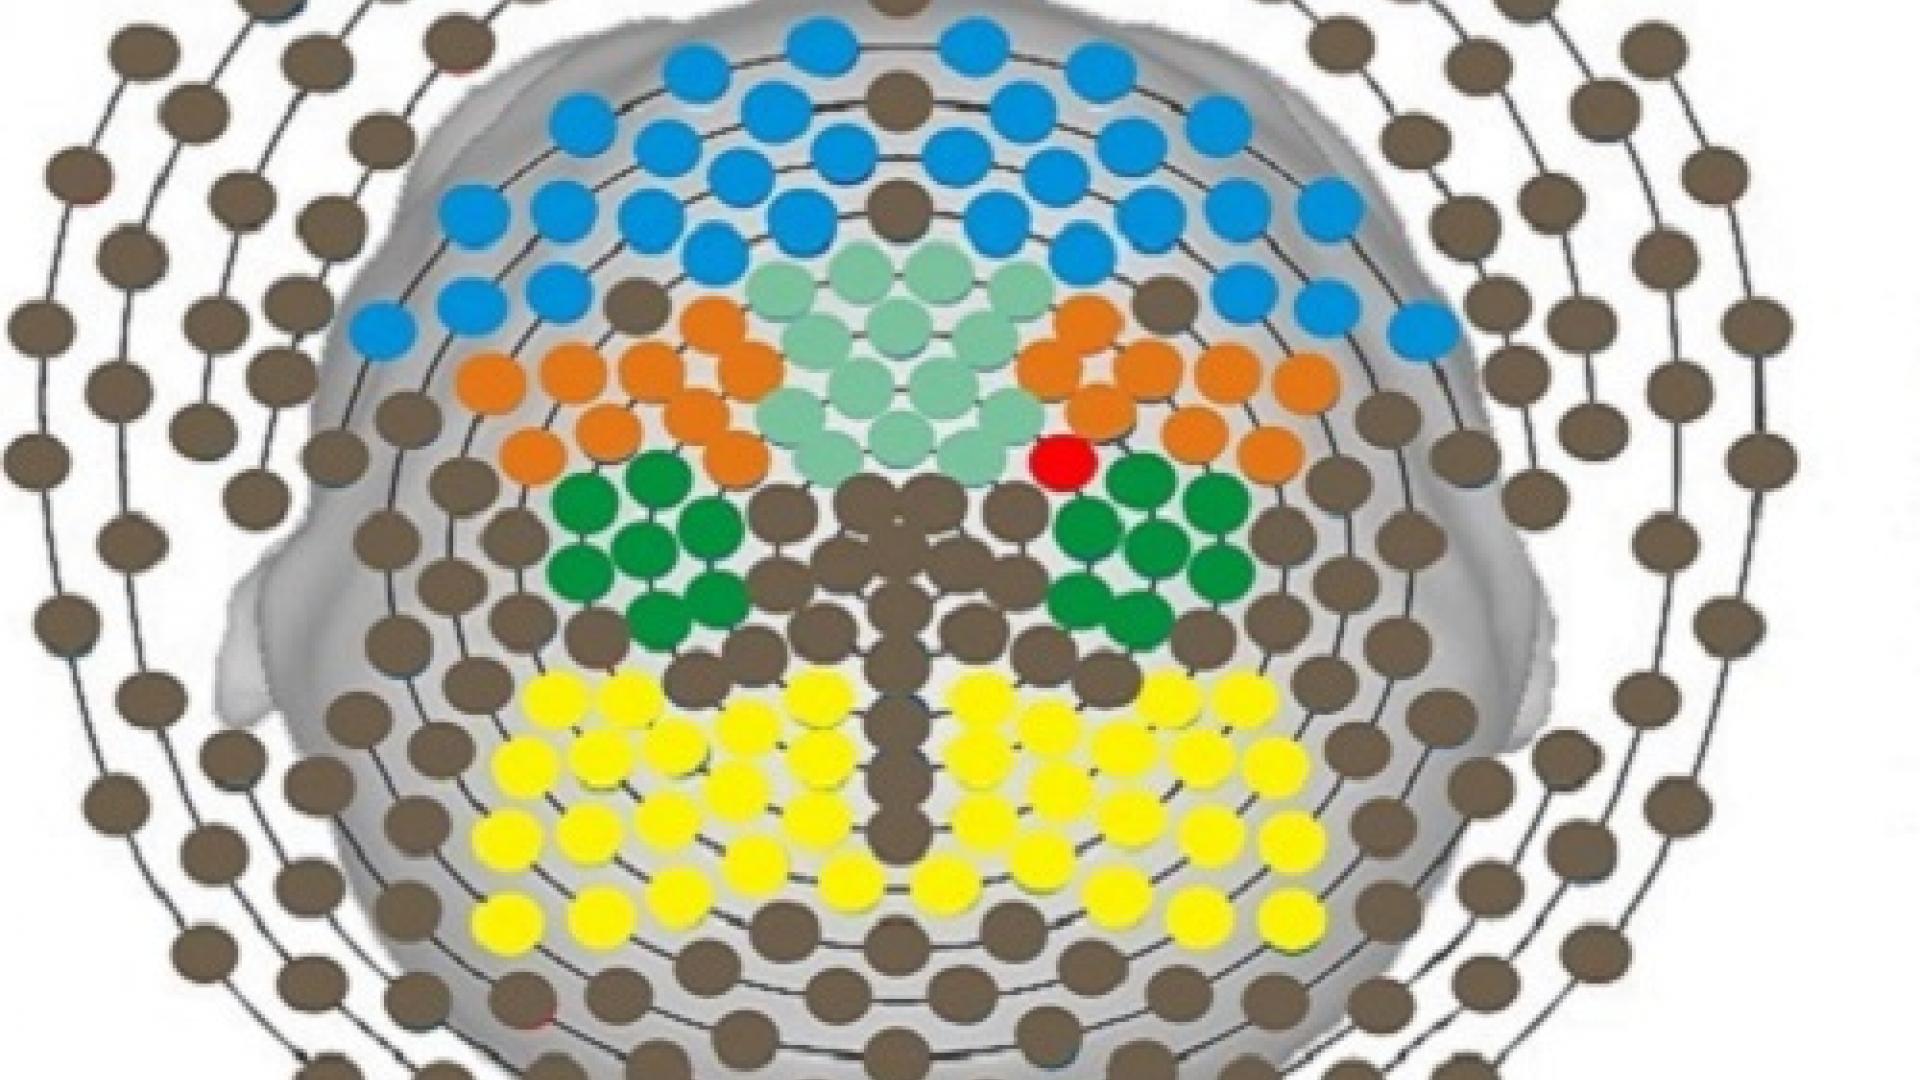
An EEG uses sensors on the scalp to detect the changes in voltage caused by the electrical signals transmitted through the nerve cells in the brain. The EEG recording reveals a complex pattern of electrical waves of different frequencies and strengths.
Changes in specific waves are associated with particular conditions such as strokes, epilepsy and tumors. Interpreting an EEG recording is challenging, especially when trying to identify significant abnormalities in the signals and the region of the brain from which they emanate.
The researchers addressed the challenges using their novel "functional boxplot" approach. The boxplot is a classical method for analyzing complex data and depicting it graphically within boxed regions. In 2011, Sun and Genton unveiled a specific functional boxplot method suitable for analyzing large and complex sets of data (for example, from clinical settings).
The KAUST team and colleagues at UCI have now shown that their method can help interpret an EEG recording. The process generates "spectral curves" indicating the contribution from waves at different frequencies. Comparing the curves generated at different times and from different sensors can aid with identifying events in brain activity that deviate from what is expected in the normal state. The clinical significance of the deviation can then be explored.
“Our colleague Steven Cramer, a neurologist and stroke expert at the University of California, is excited about the possible use of this method in clinical research and practice,” Sun said.
Read the full article