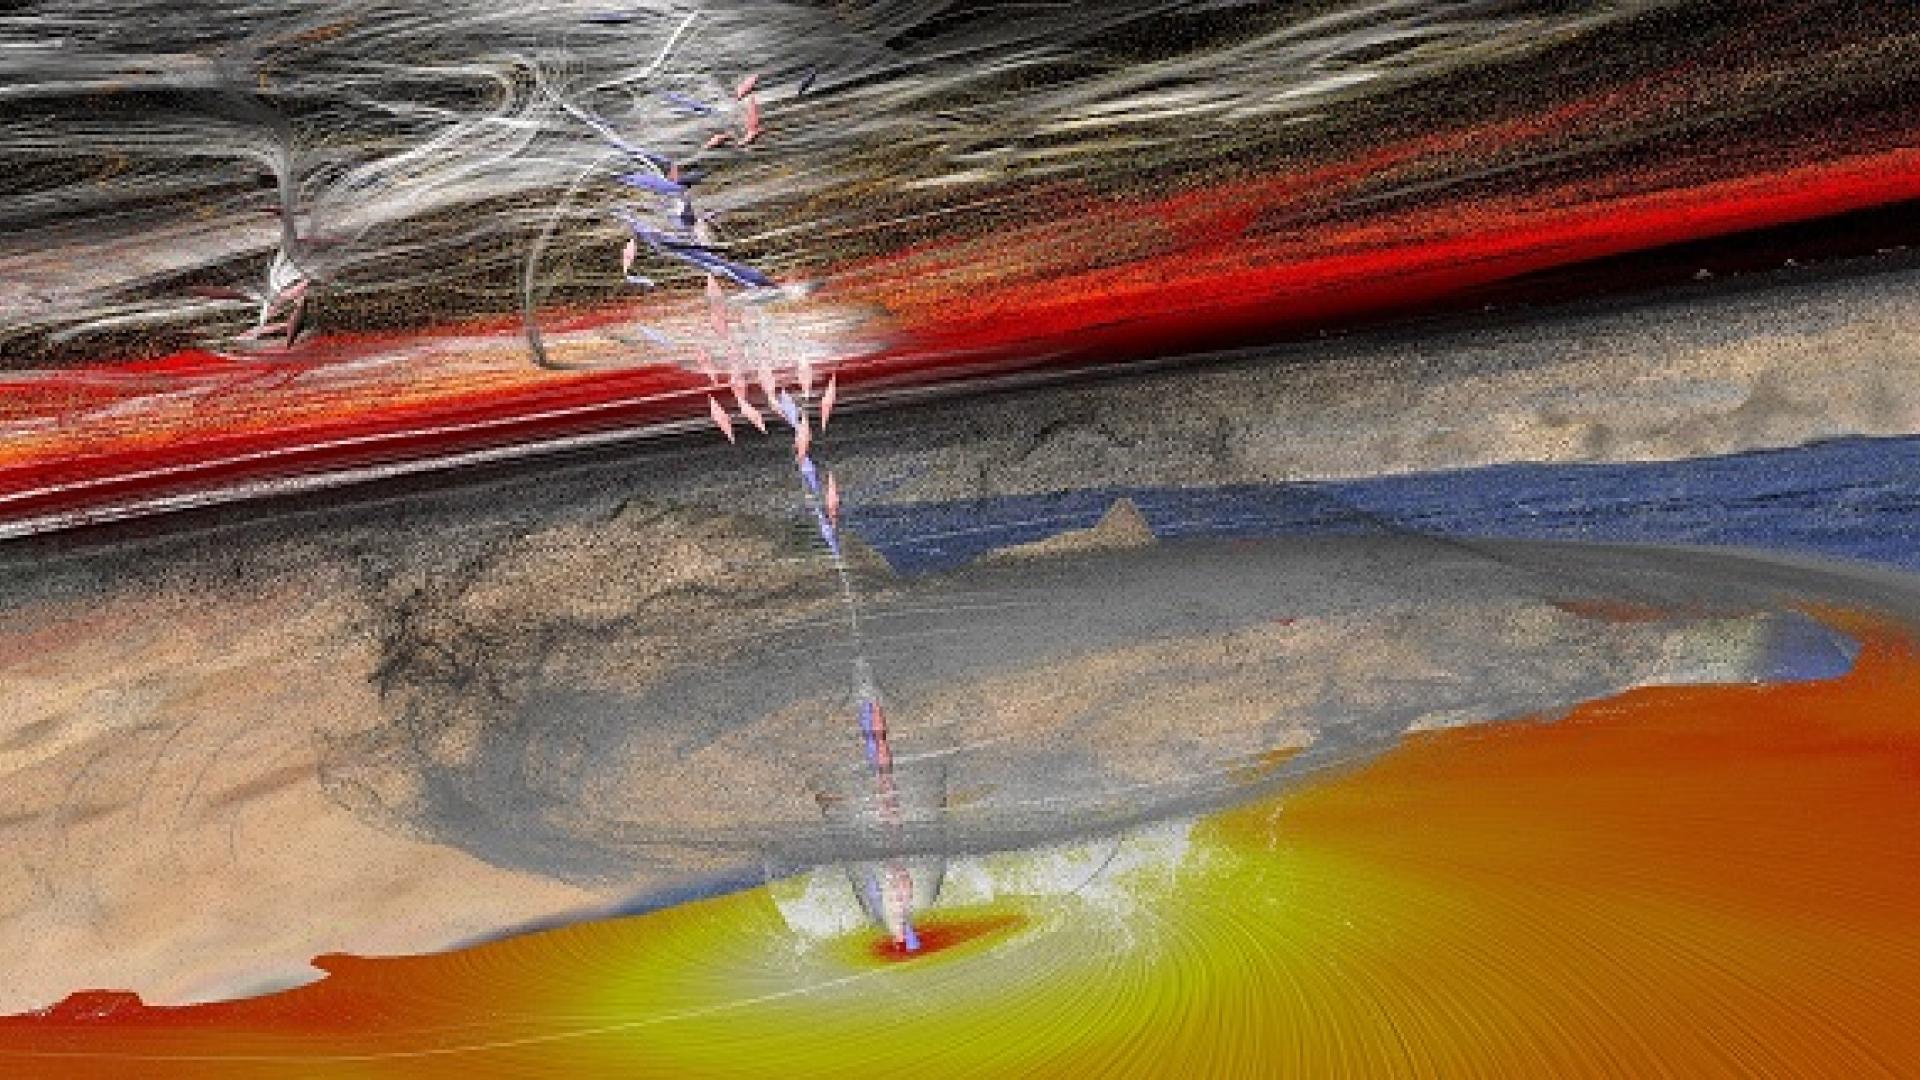
© 2017 Visualization by Thomas Theubl: similar by Hari Prasad Dasari; Ibrahim Hoteit.
There’s a certain beauty to data. Whether it’s an infographic on research collaboration or a complex map of genomic data, the interplay between variables is often better appreciated from a visual display than from a table of numbers.
But the utility of these tools goes beyond the production of aesthetically pleasing graphs. Enabled by more powerful technology, scientists at KAUST are increasingly considering how graphic analysis can benefit their studies.
KAUST’s Visualization Core Laboratory is home to state-of-the-art visualization, interaction and computational resources that allow researchers to present and explore scientific data. Their expertise is anchored in data analysis and visualization, both key elements of the scientific process, enabling researchers to evaluate their experiments and to ask new questions that could lead to discoveries.
Visualization as a core analytical tool
Daniel Acevedo-Feliz, former Director of the Visualization Core Lab, says their work helps scientists to “see the unexpected,” through audiovisual experiences that literally immerse researchers in their data and understand it in a new way. For example, one group of researchers approached the lab staff with their model of salt deposition in turbulent waters. When scientists in the lab recreated the model on-screen, the researchers realized they had overlooked a potentially important aspect of how the process works in the real world.
Visualization can also be used to validate research, as was the case with Ibrahim Hoteit, whose researchers brought their storm model (see image) to the Visualization Core Lab, where the team used it to simulate a real storm from 2015 and compare it to how the storm actually played out on satellite imagery. “We put them side-by-side…and it really tracked. It was in the position that it actually happened. That was a good result,” says Acevedo-Feliz.
Diving into science
With the advent of high-definition virtual reality, scientists now have the ability to get up close and personal with their research. “One of the key elements we use is not just the visuals but interaction,” says Acevedo-Feliz, describing how the researchers utilize the KAUST Virtual Reality (VR) advanced facilities.
“They use interaction as the main tool for them to discover potentially interesting things. They get the data from the microscopes, slice it, reconstruct it and then come to the Visualization Lab to use the VR facilities because this provides them that extra insight into complex phenomena.”
“Changing the perspectives also changes the way scientists approach the data,” says Acevedo-Feliz.
In this way, visualization transcends being just a way to display research, to be a real tool for discovery. With VR, visualization can take data from the wall or the page and bring it to life in 3D.
Read the full article
Related Persons