Several toolboxes have been developed inside the Biostatistics Research Group. Along with the formal treatment of the respective statistical models, we also focused on developing applications that can fulfill the requirements in the research community and other spaces where the models could be applied. Thus, we provide reliable software that can be used as a complement of other research pipelines while maximizing the dissemination of our research output. Our toolboxes are also focused on reducing user concerns such as data privacy sensitivity (RITS), memory and time computation optimization for big data purposes (RTVAR), or seamless user interaction for data exploration (eXSD, epiTX).
RITS: Robust Interrupted Time Series
RITS provides an interactive user interface for modeling, assessing, and interpreting interrupted time series on the framework of complex policy interventions based on the robust interrupted time series model in [RITS1] and [RITS2]. The toolbox is cross-platform, standalone, and privacy-focused. It does not require any dependency on external software libraries or network functionalities, and, therefore, it does not share data outside the user's computer (conditions required for the analysis on sensible information). The software's core and visual components were programmed using the Javascript and Nim programming languages with a high focus on interactivity. A paper with the implementation details was submitted to the "BMC Research Methodology" journal [RITS3].
The source code and installation details can be accessed in the GitHub repository [here].

Related papers:
[RITS2] Cruz, M., Gillen, D. L., Bender, M., & Ombao, H. (2019). Assessing health care interventions via an interrupted time series model: study power and design considerations. Statistics in medicine, 38(10), 1734-1752. doi:10.1002/sim.8067
[RITS1] Cruz, M., Bender, M., & Ombao, H. (2017). A robust interrupted time series model for analyzing complex health care intervention data. Statistics in medicine, 36(29), 4660-4676. doi:10.1002/sim.7443
[RITS3] Cruz M., Pinto M., Gillen D., and Ombao H. RITS: A Toolbox for Assessing Complex Interventions via Interrupted Time Series Models. In submission.
RTVAR: Real-Time Double-Exponential Vector Autoregressive Model Estimator
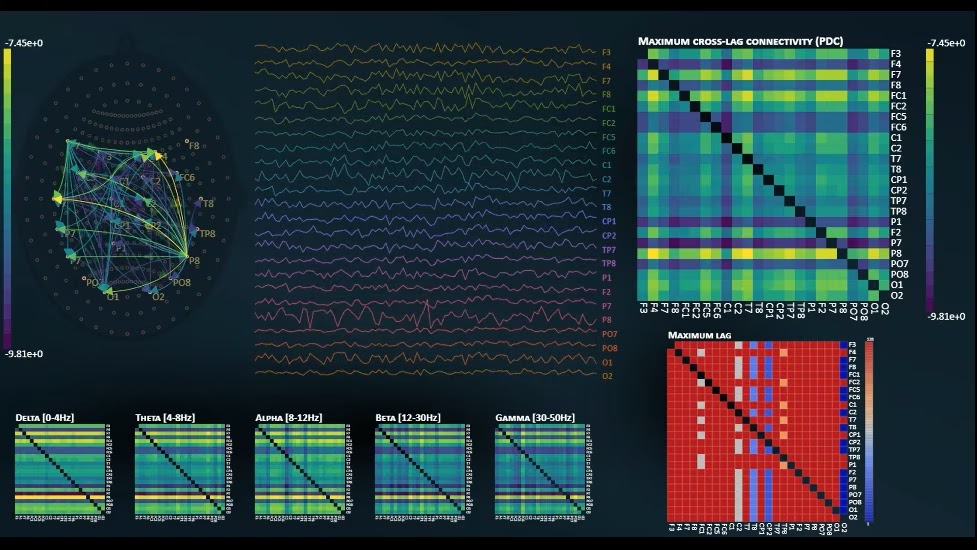
RTVAR is a real-time estimation visualization engine for the parameter estimation of vector autoregressive models (VAR) and connectivity metrics in big data. It uses an optimized algorithm that estimates the model parameters recursively with minimal memory requirements and low latency responses. For instance, it allows us to provide real-time estimations in less than 5ms (VAR model) or 26ms (with partial directed coherence estimates) in large models involving 128 simultaneous time points in 24-channel electroencephalogram data. The equivalent analysis would require a workstation to perform such calculations with offline methods. The speed/memory tests were performed on a laptop with an Intel i5 (8th generation) processor with 8GB RAM. Furthermore, the software was completed with a web interface to observe the network dependence estimations with real-time updates. This toolbox was designed in a client/server architecture such that the web interface can be accessed from different nodes in an intranet. The core algorithms of this toolbox were written in the Nim programming language, while the visualization components were written in the Javascript programming language using the WebGL features of the standard HTML5.
The source code is currently in a private GitHub repository [here], but it an updated copy can be accessed from the URL [here].
eXSD: Exploratory Spectral Dependence
eXSD is a software package that provides a platform for exploring spectral dependence in time series through different algorithms. eXSD provides an extensible unified visual exploration toolbox that can be easily integrated into R scripts through a simple programming interface. This package was written in the R programming language, and the R-Shiny framework, in order to ensure cross-platform capabilities and extensibility.
The source code is currently in a private GitHub repository [here], but it an updated copy can be accessed from the URL [here].

epiTX: Epidemiology Simulation Toolbox
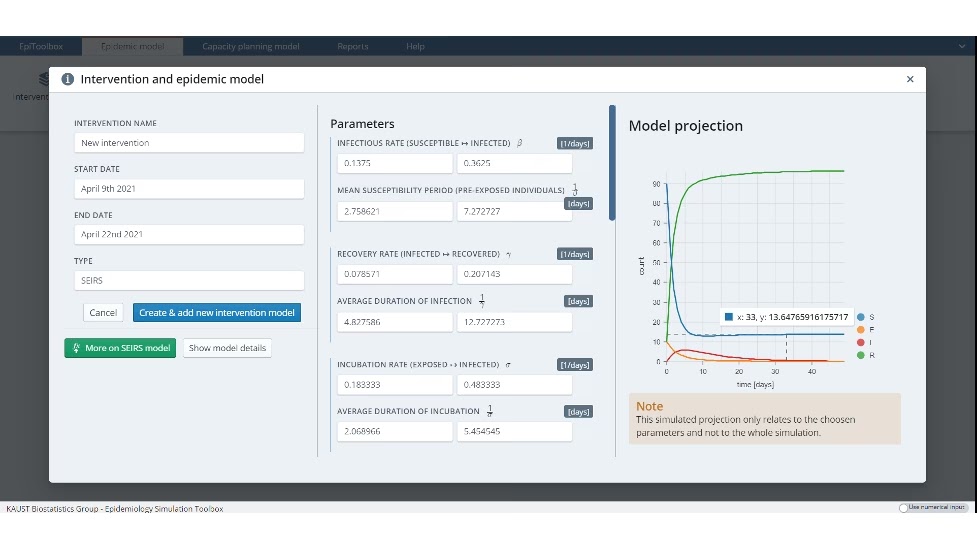
In the context of the COVID-19 pandemic, epiTX was developed as a toolbox for simulating the health system's hospitalization requirements based on piecewise SEIRS (Susceptible-Exposed-Infectious-Recovered) models. Easy-to-use and interactive web user interfaces and fast computational response were prioritized in this toolbox to facilitate a better understanding and interpretation of the output models under different hypothetical scenarios.
The source code is currently in a private GitHub repository [here], but it an updated copy can be accessed from the URL [here].
BCC: Brain Correlation Clustering
BCC is an animated visualization tool for denoting hierarchical cluster coherence in brain time series. It provided a smooth interface for visually exploring the time-evolving topographic characteristics in a 3D environment based on the results of using the hierarchical cluster coherence method described in Euan et al. [HCC]. It was entirely written in the Javascript programming language using the functionalities of the WebGL standard.
The source code of BCC is currently in a private GitHub repository [here], but it an updated copy can be accessed from the URL [here].

Related paper:
[HCC] Euán, C., Sun, Y. & Ombao, H. Coherence-based time series clustering for brain connectivity visualizations. arXiv preprint arXiv:1711.07007. 19 Nov 2017.
kMindConnect
kMindConnect is a software package developed with the aim of offering seamless integration between different Brain dynamic connectivity modeling and the visualization results. The toolbox provides an easy way to present the dynamic changes in the estimated Brain states (or connectivity.) The default model to perform this estimation inside the application is the switching-regime vector autoregressive model (S-VAR) that is fitted over clustered time-varying vector autoregressive (TV-VAR) coefficients from the data input [Ting, Samdin, Ombao, 2016].
The source code and installation details can be accessed in the GitHub repository [here].
COVID-19 epidemic simulator
R-shiny simulator for exploring the role of the transmission rate and infectious period on the infection and recovery rates.
The R-shiny app can be accessed [here]