© 2019 Amanda Fiore
Modeling the spatial relationships among the main types of air pollutants has given KAUST researchers new insights into how they form in different regions and seasons, which could guide policies to manage pollution.
Each year, air pollution causes strokes, lung and heart diseases, and lung cancers, which are responsible for millions of deaths around the world. Although air pollution comes in many forms, the main factor is particles smaller than 2.5 micrometers, or 1/400th of a millimeter, which typically contains dust and soot, as well as significant levels of chemicals, such as sulfates and ammonium.
One of the major generators of 2.5-micrometer particulate matter (PM2.5) is a chemical reaction that turns gaseous sulfur and nitrogen—largely from vehicle exhaust and factory emissions—into larger and more toxic sulfate, nitrate and ammonium molecules. Because more than half of PM2.5 can be made up of these "secondary" chemicals, reducing sulfur and nitrogen emissions is seen as a way to bring down air pollution levels.
Identifying precisely where the harmful emissions occur can be challenging, particularly in industrializing regions. KAUST statisticians Ying Sun and Wu Wang applied a sophisticated statistics approach to more clearly find the locations where the drivers of air pollution are strongest and have used it to analyze the pattern of emissions in China.
“Chemical actions of nitrogen dioxide and sulfur dioxide with ozone and ammonia contribute a considerable share of total PM2.5 in China,” says Wang. “The spatially varying relationship between these primary and secondary components is usually modeled by estimating a relationship parameter for each location. However, this is computationally intensive and produces rough and biased estimates that get more inaccurate at the edges of the map. Our method uses a smaller number of anchor locations and polynomial functions to approximate the spatially varying parameters, which greatly reduces the computational time.”
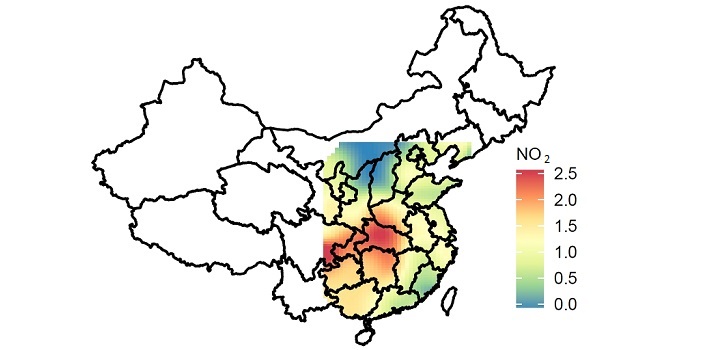
Previous methods estimate the spatially varying parameters for each location separately and often produce wildly varying distributions, and thus, offered limited insight into the regional atmospheric drivers of pollution generation. Wang and Sun instead derived smoothly varying functions at each anchor location using the relative contribution from all data points in the region using a "penalty" for increasing distance.
Read the full article
Related Persons