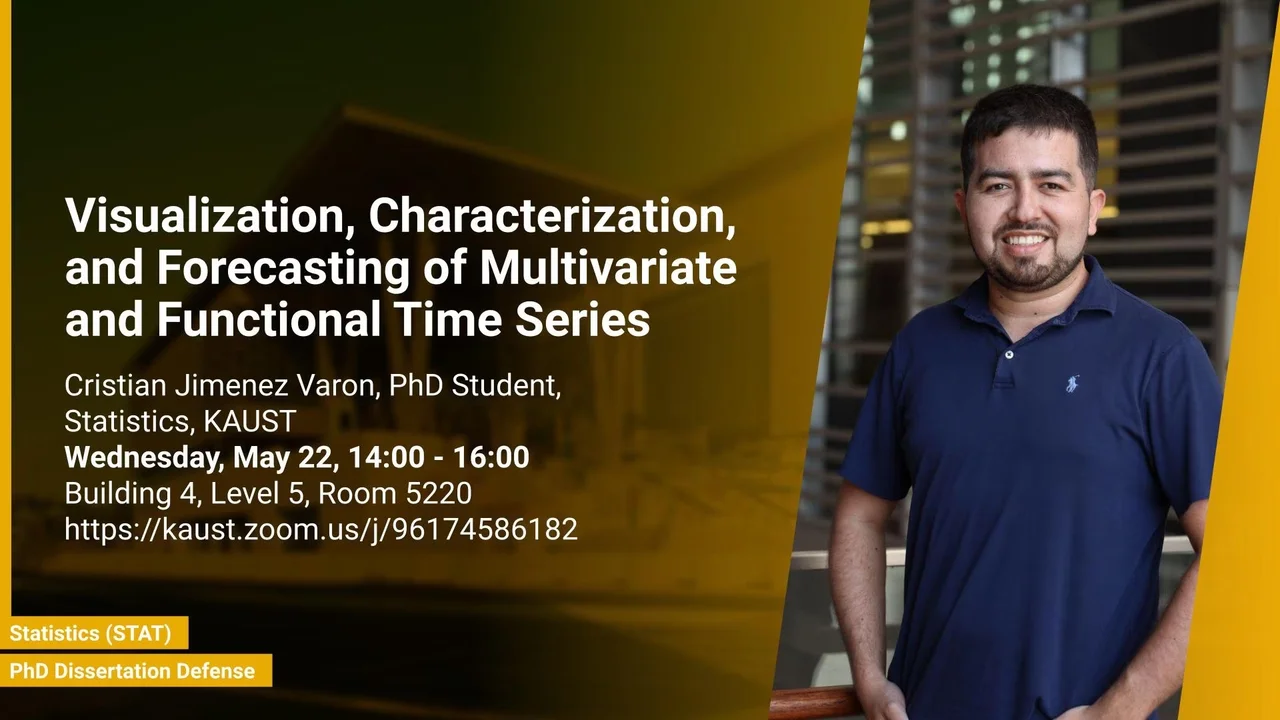
Visualization, Characterization, and Forecasting of Multivariate and Functional Time Series
B4 L5 R5220
This thesis explores advanced statistical models and methods for analyzing multivariate and functional time series data. It focuses on various aspects of statistical analysis, including visualization, robust outlier detection, inference, and forecasting. It addresses challenges in outlier detection for functional data, quantile spectral estimation for multivariate time series, and high-dimensional functional time series forecasting, with applications in environmental, financial, and demographic fields.
Overview
Abstract
This thesis explores advanced statistical models and methods for analyzing multivariate and functional time series data. It focuses on various aspects of statistical analysis, including visualization, robust outlier detection, inference, and forecasting. It addresses challenges in outlier detection for functional data, quantile spectral estimation for multivariate time series, and high-dimensional functional time series forecasting, with applications in environmental, financial, and demographic fields.
This thesis begins by introducing a novel approach that utilizes pointwise data depth to effectively visualize univariate and multivariate functional data and identify potential outliers. This method enhances the visualization of magnitude outliers by considering the distribution of pointwise data depth and detects shape outliers through the correlation between pairwise depths. The effectiveness of this functional outlier detection algorithm is demonstrated on photovoltaic (PV) system datasets. It then presents a semi-parametric estimator for quantile coherence, to capture nonlinear dependencies in multivariate time series at different quantile levels. The proposed estimation technique combines a parametric spectrum model of a vector autoregressive (VAR) process with nonparametric smoothing techniques across quantiles. It is shown that the use of the proposed quantile coherence estimator as the feature significantly improves multivariate time series clustering. The utility of this technique is showcased through its application to financial stock data, revealing the structure of diversified investment portfolios. The thesis also introduces a method for modeling and forecasting high-dimensional functional time series (HDFTS) that display cross-sectional correlation and temporal dependence. The HDFTS are decomposed via a functional analysis of variance (FANOVA) model into deterministic and time-varying residual components. Functional principal component analysis is employed when forecasting the residual component. The proposed method is applied to age- and sex-specific mortality rates in the United States, France, and Japan, yielding more accurate point and interval forecasts than benchmark methods. Finally, a statistical method is introduced for modeling and forecasting functional panel data, where each element represents a density function. The proposed method employs a center log-ratio transformation to convert densities into unconstrained functions. The thesis then conducts a thorough comparison of existing forecasting methods for HDFTS as applied to unconstrained functional panel data. This comparison shows that the forecasting methodology based on FANOVA, as discussed earlier, achieves comparable forecasting accuracy to its competitors in terms of forecasting error for age- and sex-specific life table death counts.
Brief Biography
Cristian is a PhD candidate in statistics at KAUST. Cristian works under the supervision of Dr. Ying Sun within the environmental statistics research group. His PhD focuses on quantile spectral analysis for multivariate time series, functional data outlier detection, and functional time series forecasting with applications in environment, demography, and finance.
Before joining KAUST, Cristian obtained a bachelor's degree in engineering and a master's degree in applied mathematics from the Universidad Nacional de Colombia.

