About Markus Hadwiger Markus Hadwiger Professor, Computer Science visualization visual computing Markus Hadwiger is a Professor of Computer Science at the King Abdullah University of Science and Technology (KAUST). A founding member of the University, he conducts fundamental and applied research in scientific visualization and visual computing. Events Presented Events Aug 29 - Sep 4, 2021 Large-Scale Visualization of Scientific Data: Volume Data and Flow Fields - 2021-08-30 Markus Hadwiger, Professor, Computer Science Aug 30, 12:00 - 13:00 B9 R2322 H1 This talk will give an overview of the research of the High-Performance Visualization research group (vccvisualization.org) at the KAUST Visual Computing Center (VCC). Interactive visualization is crucial to exploring, analyzing, and understanding large-scale scientific data, such as the data acquired in medicine or neurobiology using computed tomography or electron microscopy, and data resulting from large-scale simulations such as fluid flow in the Earth’s atmosphere and oceans. The amount of data in data-driven science is increasing rapidly toward the petascale and further. Feb 21 - Feb 27, 2021 Large-Scale Visualization of Scientific Data Markus Hadwiger, Professor, Computer Science Feb 23, 15:00 - 16:30 KAUST data visualisation "A picture is worth a thousand words", and by going beyond static images, interactive visualization has become crucial to exploring, analyzing, and understanding large-scale scientific data. This is true for many areas of science and engineering, such as high-resolution imaging in neuroscience or materials science, as well as in large-scale fluid simulations of the Earth’s atmosphere and oceans, or of trillion-cell oil reservoirs. However, the fact that the amount of data in data-driven sciences is increasing rapidly toward the petascale, and further, presents a tremendous challenge to interactive visualization and analysis. Nowadays, an important enabler of interactivity is often the parallel processing power of GPUs, which, however, requires well-designed customized data structures and algorithms. Furthermore, scientific data sets do not only get larger, they also get more and more complex, and thus have become very hard to interpret and analyze. In this talk, I will give an overview of the research of my group in large-scale scientific visualization, from data structures and algorithms that enable petascale visualization on GPUs, to novel visual abstractions for interactive analysis of highly complex structures in neuroscience, to novel mathematical techniques that leverage differential geometric methods for the detection and visualization of features in large, complex fluid dynamics data on curved surfaces such as the Earth. Aug 30 - Sep 5, 2020 Large-Scale Visualization of Scientific Data: Volume Data and Flow Fields - 2020-08-31 Markus Hadwiger, Professor, Computer Science Aug 31, 12:00 - 13:00 KAUST Abstract Welcome to the new semester! This talk will give an overview of the research of the High-Performance Visualization research group (vccvisualization.org) at the KAUST Visual Computing Center (VCC). Interactive visualization is crucial to exploring, analyzing, and understanding large-scale scientific data, such as the data acquired in medicine or neurobiology using computed tomography or electron microscopy, and data resulting from large-scale simulations such as fluid flow in the Earth’s atmosphere and oceans. The amount of data in data-driven science is increasing rapidly toward the
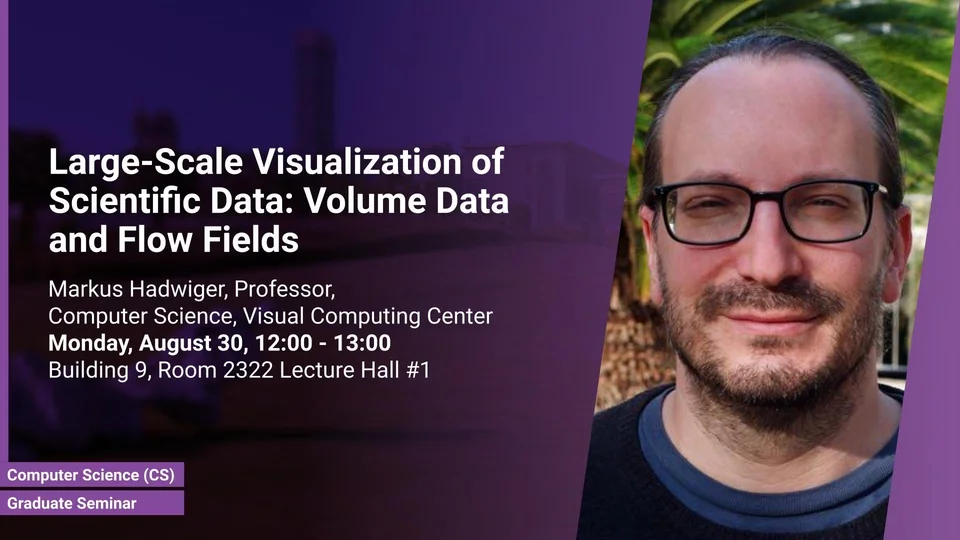
Large-Scale Visualization of Scientific Data: Volume Data and Flow Fields - 2021-08-30 Markus Hadwiger, Professor, Computer Science Aug 30, 12:00 - 13:00 B9 R2322 H1 This talk will give an overview of the research of the High-Performance Visualization research group (vccvisualization.org) at the KAUST Visual Computing Center (VCC). Interactive visualization is crucial to exploring, analyzing, and understanding large-scale scientific data, such as the data acquired in medicine or neurobiology using computed tomography or electron microscopy, and data resulting from large-scale simulations such as fluid flow in the Earth’s atmosphere and oceans. The amount of data in data-driven science is increasing rapidly toward the petascale and further.
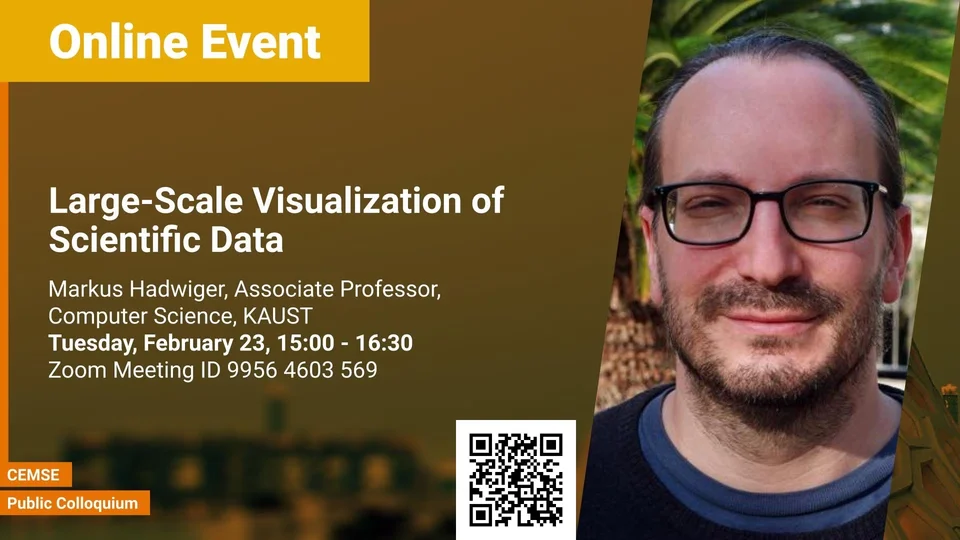
Large-Scale Visualization of Scientific Data Markus Hadwiger, Professor, Computer Science Feb 23, 15:00 - 16:30 KAUST data visualisation "A picture is worth a thousand words", and by going beyond static images, interactive visualization has become crucial to exploring, analyzing, and understanding large-scale scientific data. This is true for many areas of science and engineering, such as high-resolution imaging in neuroscience or materials science, as well as in large-scale fluid simulations of the Earth’s atmosphere and oceans, or of trillion-cell oil reservoirs. However, the fact that the amount of data in data-driven sciences is increasing rapidly toward the petascale, and further, presents a tremendous challenge to interactive visualization and analysis. Nowadays, an important enabler of interactivity is often the parallel processing power of GPUs, which, however, requires well-designed customized data structures and algorithms. Furthermore, scientific data sets do not only get larger, they also get more and more complex, and thus have become very hard to interpret and analyze. In this talk, I will give an overview of the research of my group in large-scale scientific visualization, from data structures and algorithms that enable petascale visualization on GPUs, to novel visual abstractions for interactive analysis of highly complex structures in neuroscience, to novel mathematical techniques that leverage differential geometric methods for the detection and visualization of features in large, complex fluid dynamics data on curved surfaces such as the Earth.
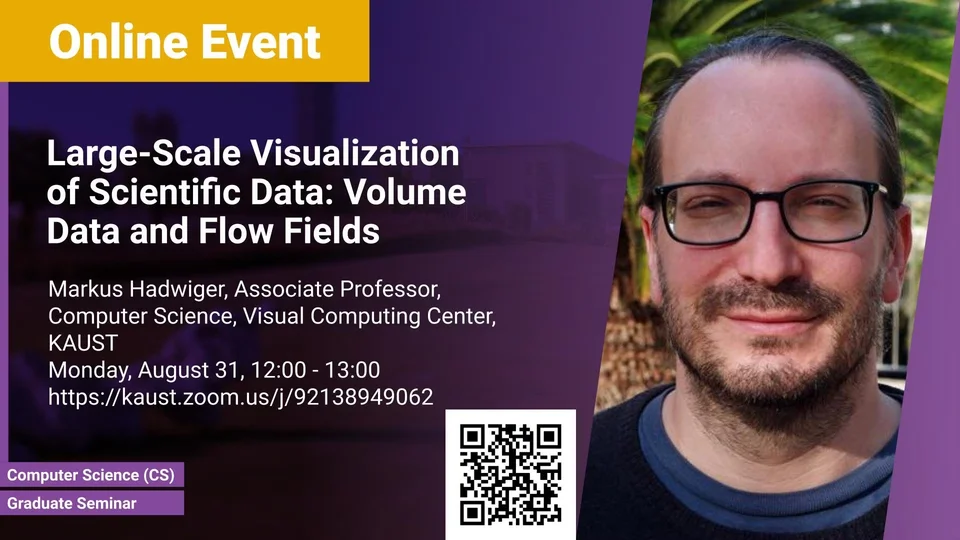
Large-Scale Visualization of Scientific Data: Volume Data and Flow Fields - 2020-08-31 Markus Hadwiger, Professor, Computer Science Aug 31, 12:00 - 13:00 KAUST Abstract Welcome to the new semester! This talk will give an overview of the research of the High-Performance Visualization research group (vccvisualization.org) at the KAUST Visual Computing Center (VCC). Interactive visualization is crucial to exploring, analyzing, and understanding large-scale scientific data, such as the data acquired in medicine or neurobiology using computed tomography or electron microscopy, and data resulting from large-scale simulations such as fluid flow in the Earth’s atmosphere and oceans. The amount of data in data-driven science is increasing rapidly toward the
Engage ORCID KAUST Repository KAUST Academic Portal Scopus ShareClipboard Related Sites Computer Science (CS) High Performance Visualization Group (VCCVIS) Related Content Articles 7 Events 3