Reproduced with permission from reference 1 © 2018 John Wiley and Sons
The lack of tools to be able to pinpoint anomalies in large datasets that vary through time sparked a search by KAUST scientists for new efficiencies to help brain research.
Searching for correlations and similarities in large datasets of time-varying information, such as brain signals, is a formidable task. One technique researchers use to test for such correlation is to analyze the signal’s frequency composition: the mix of slow and fast oscillations contained in the waveform. However, these spectral-density analyses contain a lot of low-level background noise, and so it can be difficult to identify genuine correlations from the raw spectral-density function (SDF).
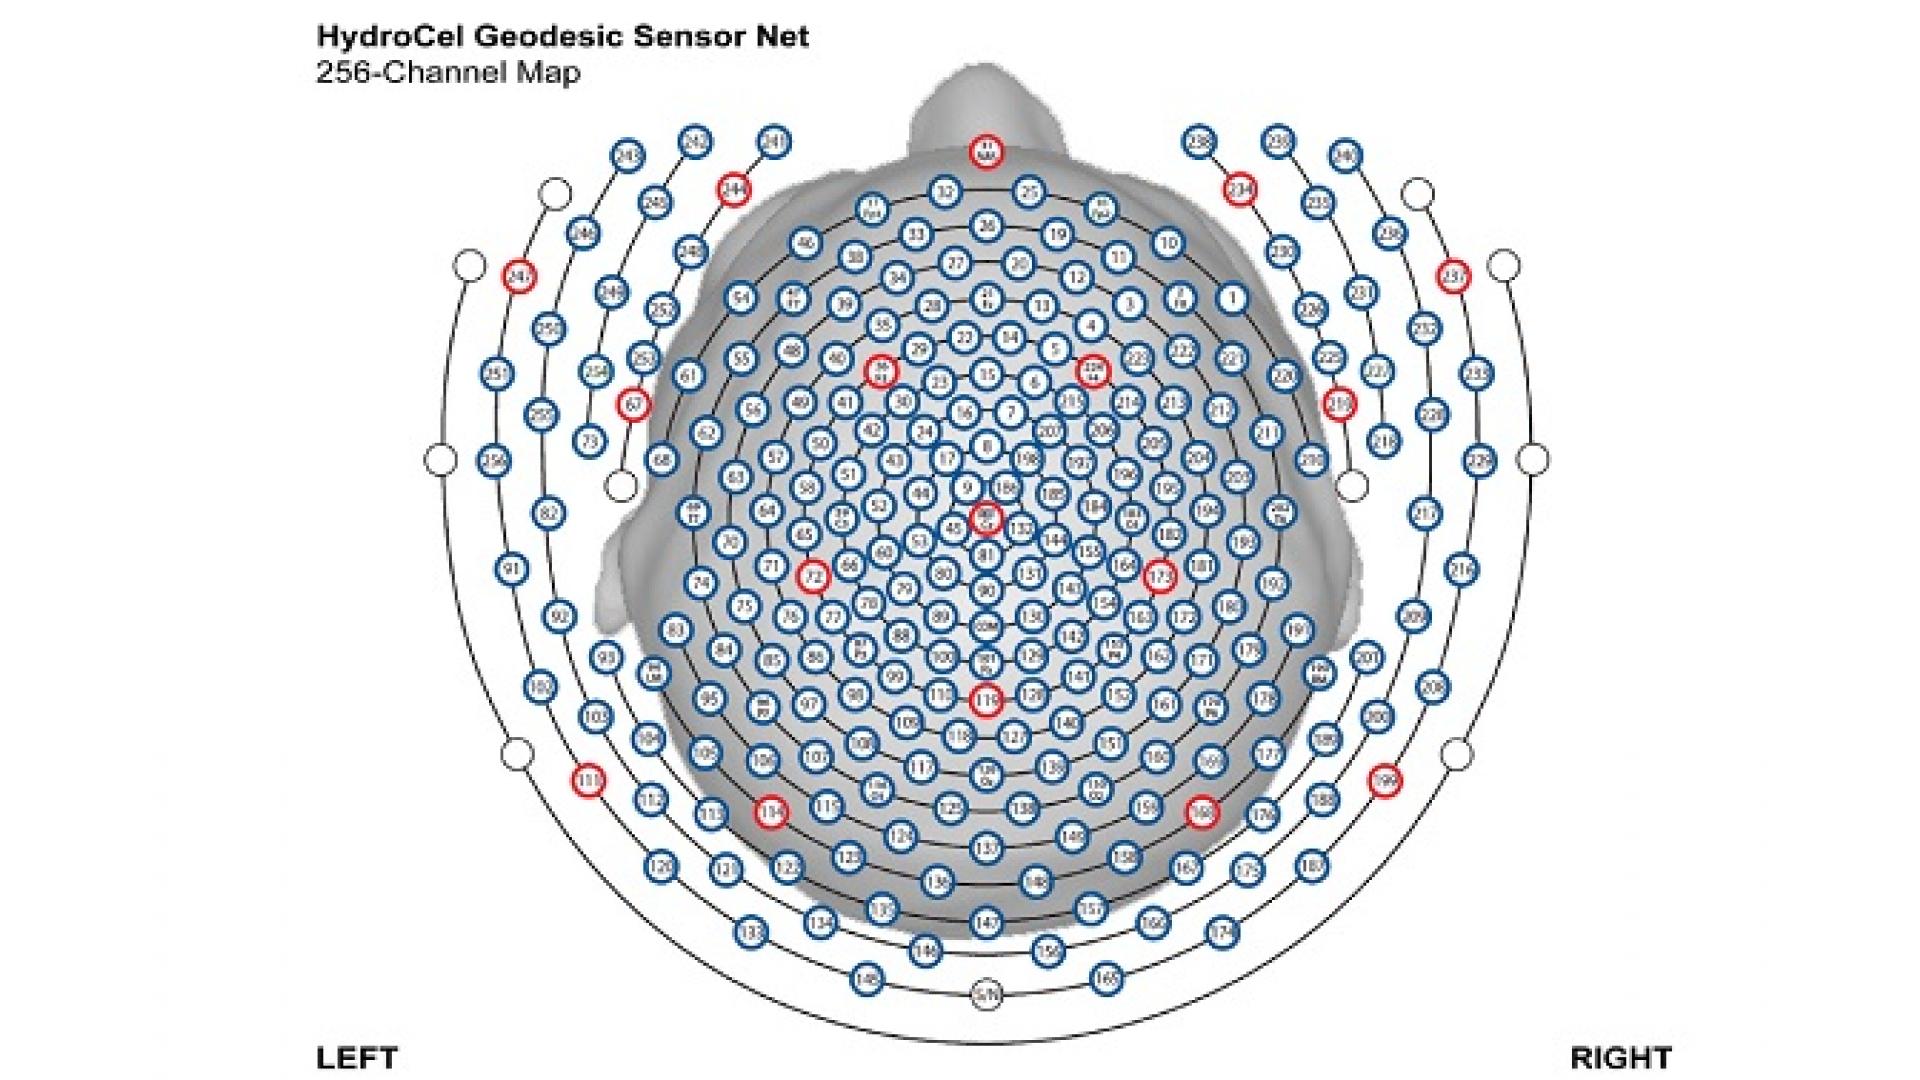
A smoothing process can be applied to reduce noise in the SDF, but the degree of smoothing needs to be optimized to avoid losing the valuable detail in the data needed to pick out real correlations. Normally, this needs to be done for each signal trace before it is compared with others. For an electroencephalogram (EEG) involving tens or hundreds of simultaneous brain signal recordings, this quickly becomes an enormous and inefficient task.
Motivated by the lack of statistical tools for dealing with such problems, KAUST researcher Ying Sun and her doctoral student Tainbo Chen, in collaboration with Mehdi Maadooliat from Marquette University in the United States, developed an efficient method for collectively estimating the SDFs for large numbers of recorded traces.
“Most existing methods either estimate the spectral density separately or suffer from computational issues,” says Chen. “Collective estimation is statistically more efficient,” he explains, “and by applying a clustering technique to reduce the dimensionality of the data, we could develop a computationally efficient method that outperforms commonly used methods and can also visualize the similarity among time series.”
Read the full article