Abstract
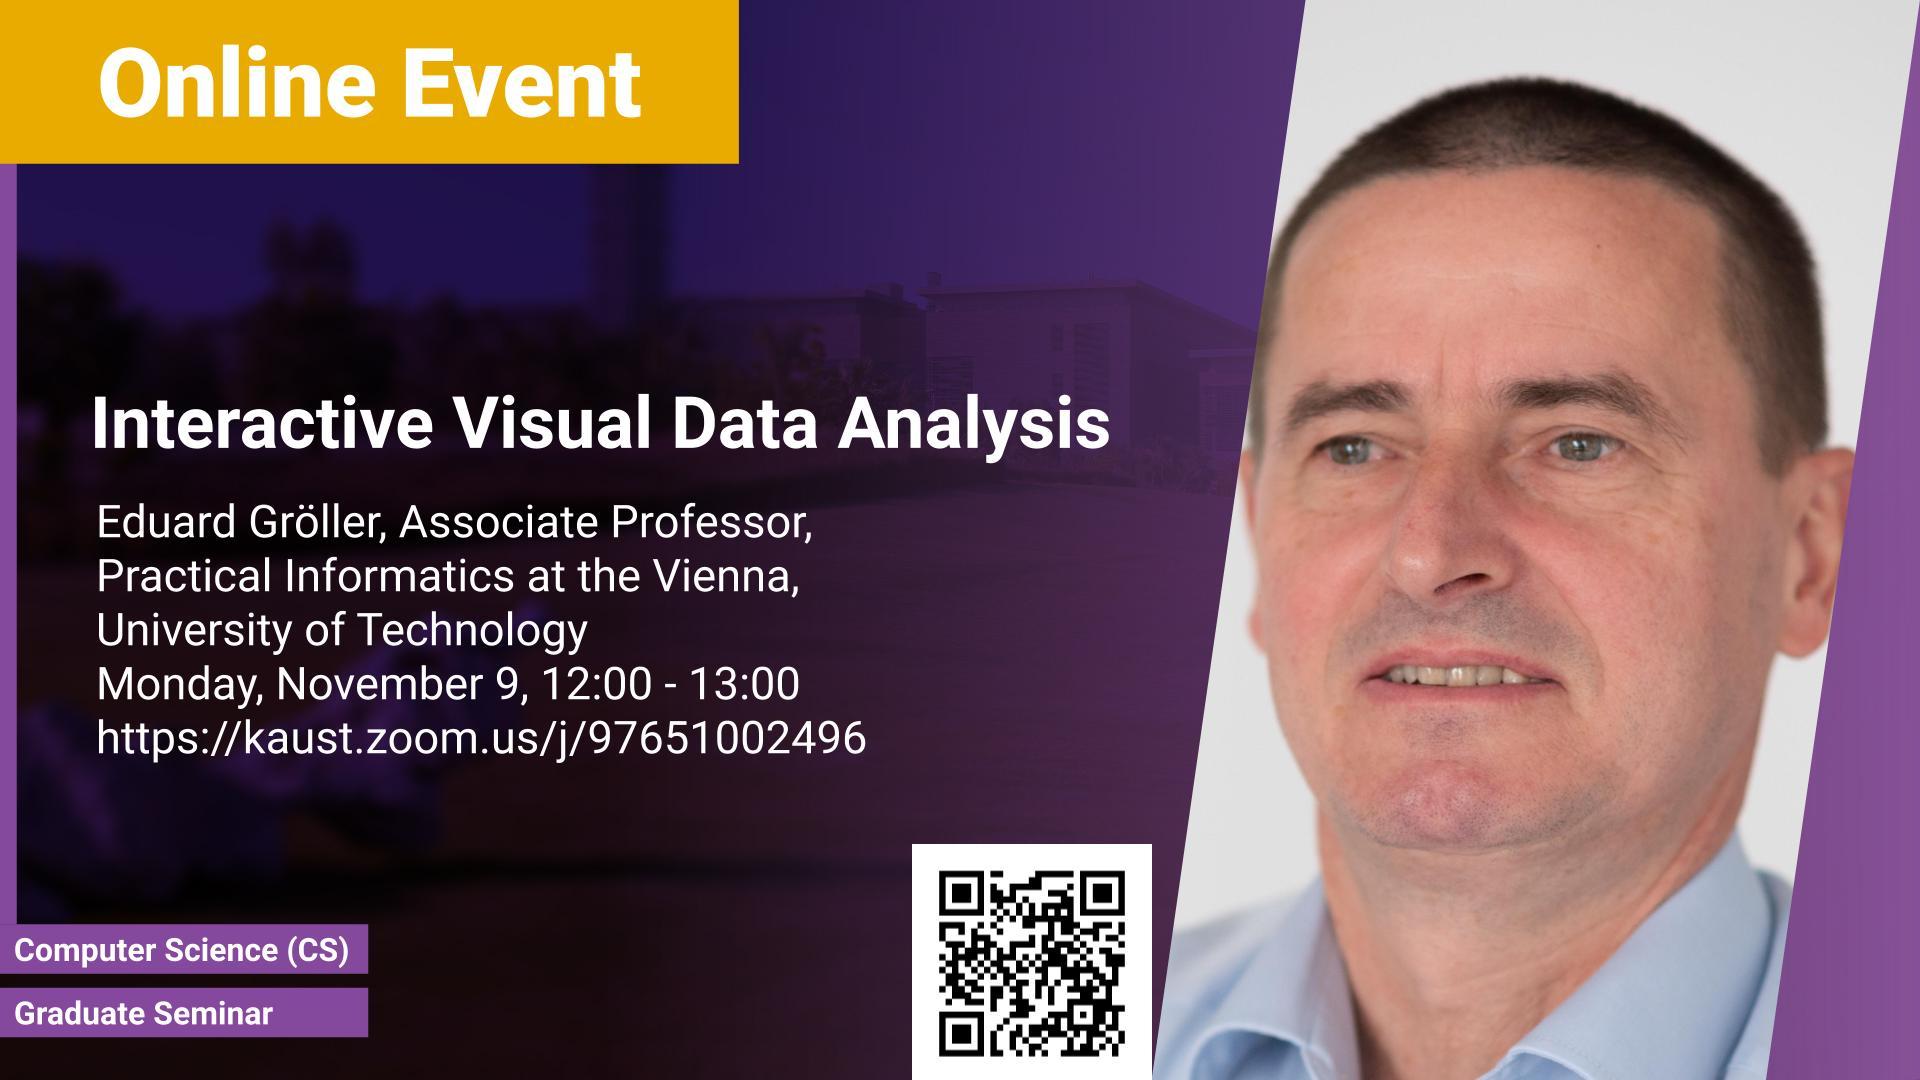
Visualization and visual computing use computer-supported, interactive, visual representations of (abstract) data to amplify cognition. In recent years data complexity concerning volume, veracity, velocity, and variety has increased considerably. This is due to new data sources as well as the availability of uncertainty, error, and tolerance information. Instead of individual objects entire sets, collections, and ensembles are visually investigated. There is a need for visual analyses, comparative visualization, quantitative visualizations, scalable visualizations, and linked/integrated views. Several examples of interactively and visually analyzing data will be discussed in detail. The concepts will be especially exemplified with a geospatial decision support system for flood management. Given the amplified data variability, interactive visual data analyses are likely to gain in importance in the future. Research challenges and directions are sketched at the end of the talk.
Brief Biography
Eduard Gröller (http://www.cg.tuwien.ac.at/staff/EduardGroeller.html) is Professor at the Institute of Visual Computing & Human-Centered Technology (VC&HCT), TU Wien, where he is heading the Research Unit of Computer Graphics. He is a scientific proponent and key researcher of the VRVis research center (http://www.vrvis.at/). The center performs applied research in visualization, rendering, and visual analysis. Dr. Gröller is Adjunct Professor of Computer Science at the University of Bergen, Norway. His research interests include computer graphics, visualization, and visual computing. He became a fellow of the Eurographics association in 2009. Dr. Gröller is the recipient of the Eurographics 2015 Outstanding Technical Contributions Award and of the IEEE VGTC 2019 Technical Achievement Award.
