Thursday, June 06, 2024, 13:00
- 15:00
Building 1, Level 4, Room 4214
Contact Person
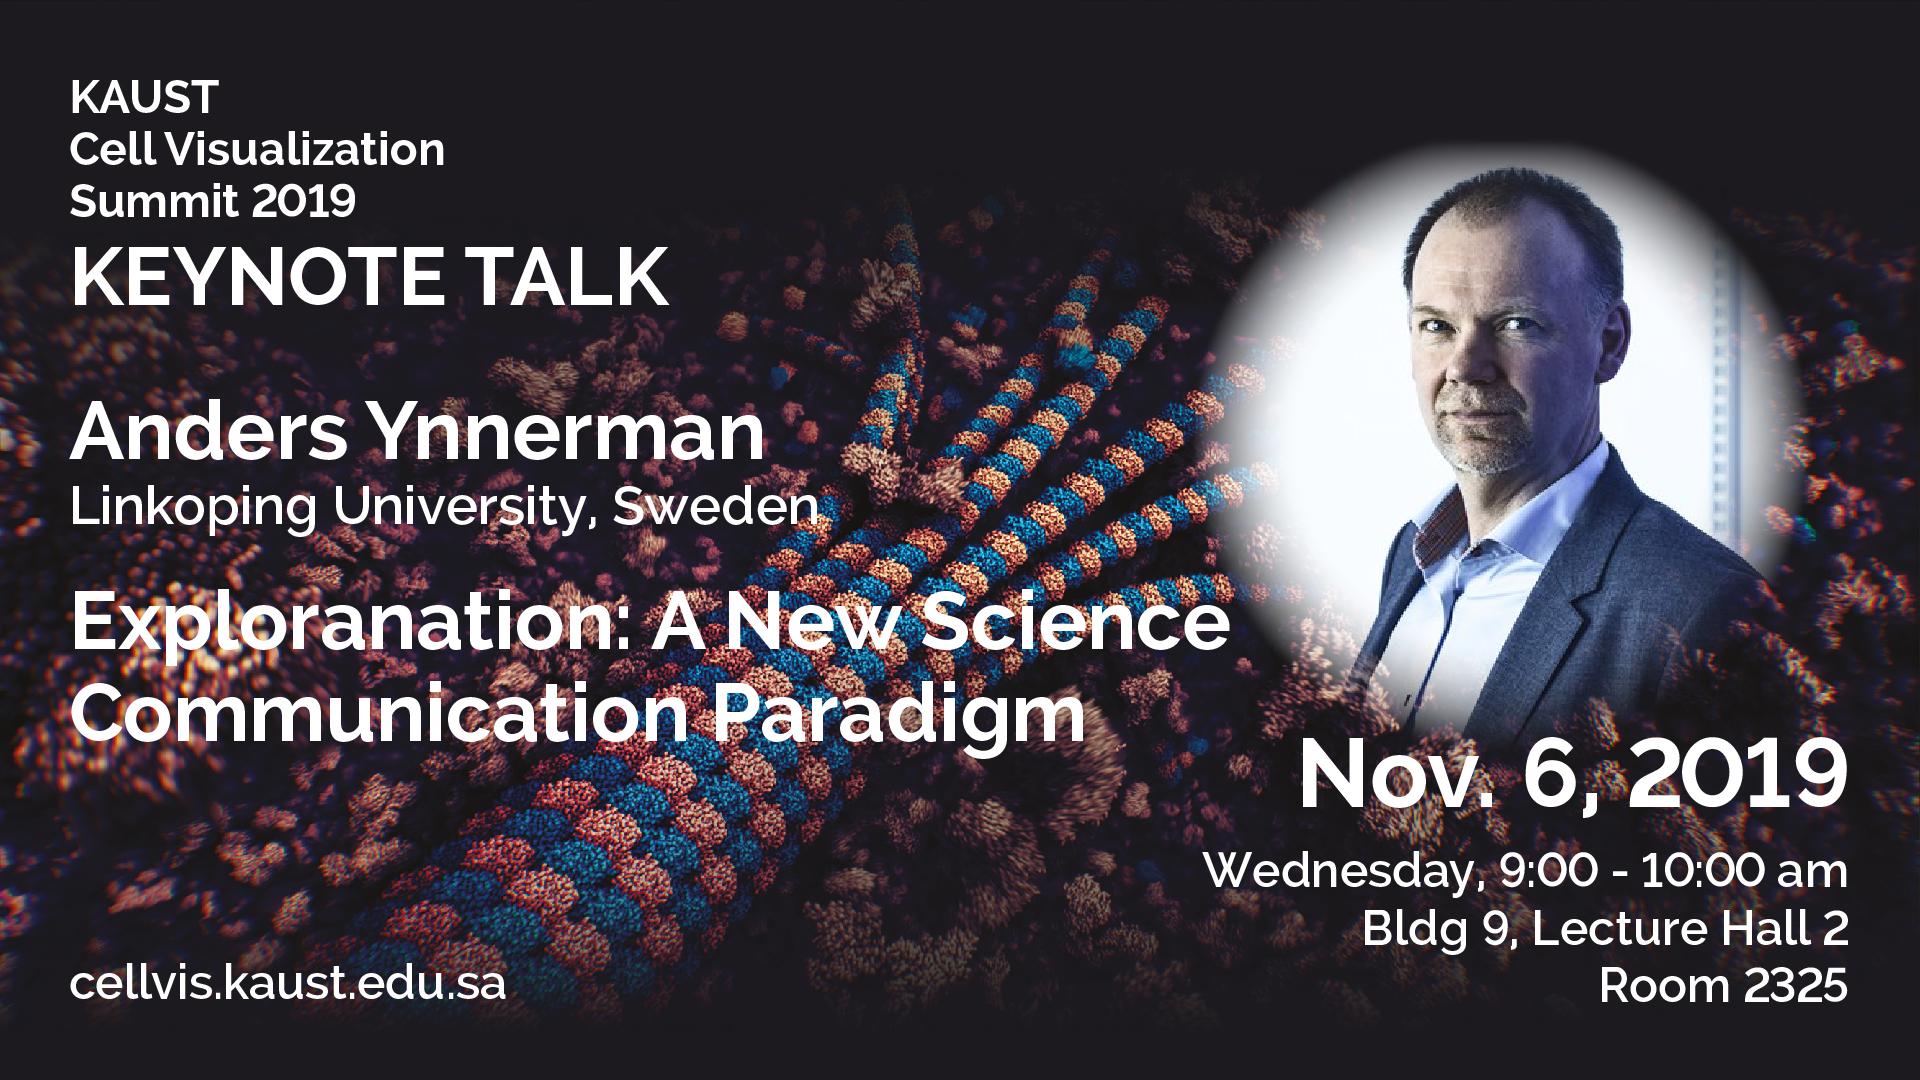
Currently, the acquisition of accurate cryogenic electron microscopy data deals with problems with complex and time-consuming processes, low signal-to-noise ratio, and missing wedge, leading to a lack of highly accurate imaging data. Such data would be necessary to develop computational methods/visualizations and essential to train deep learning models that are used to solve inverse problems.
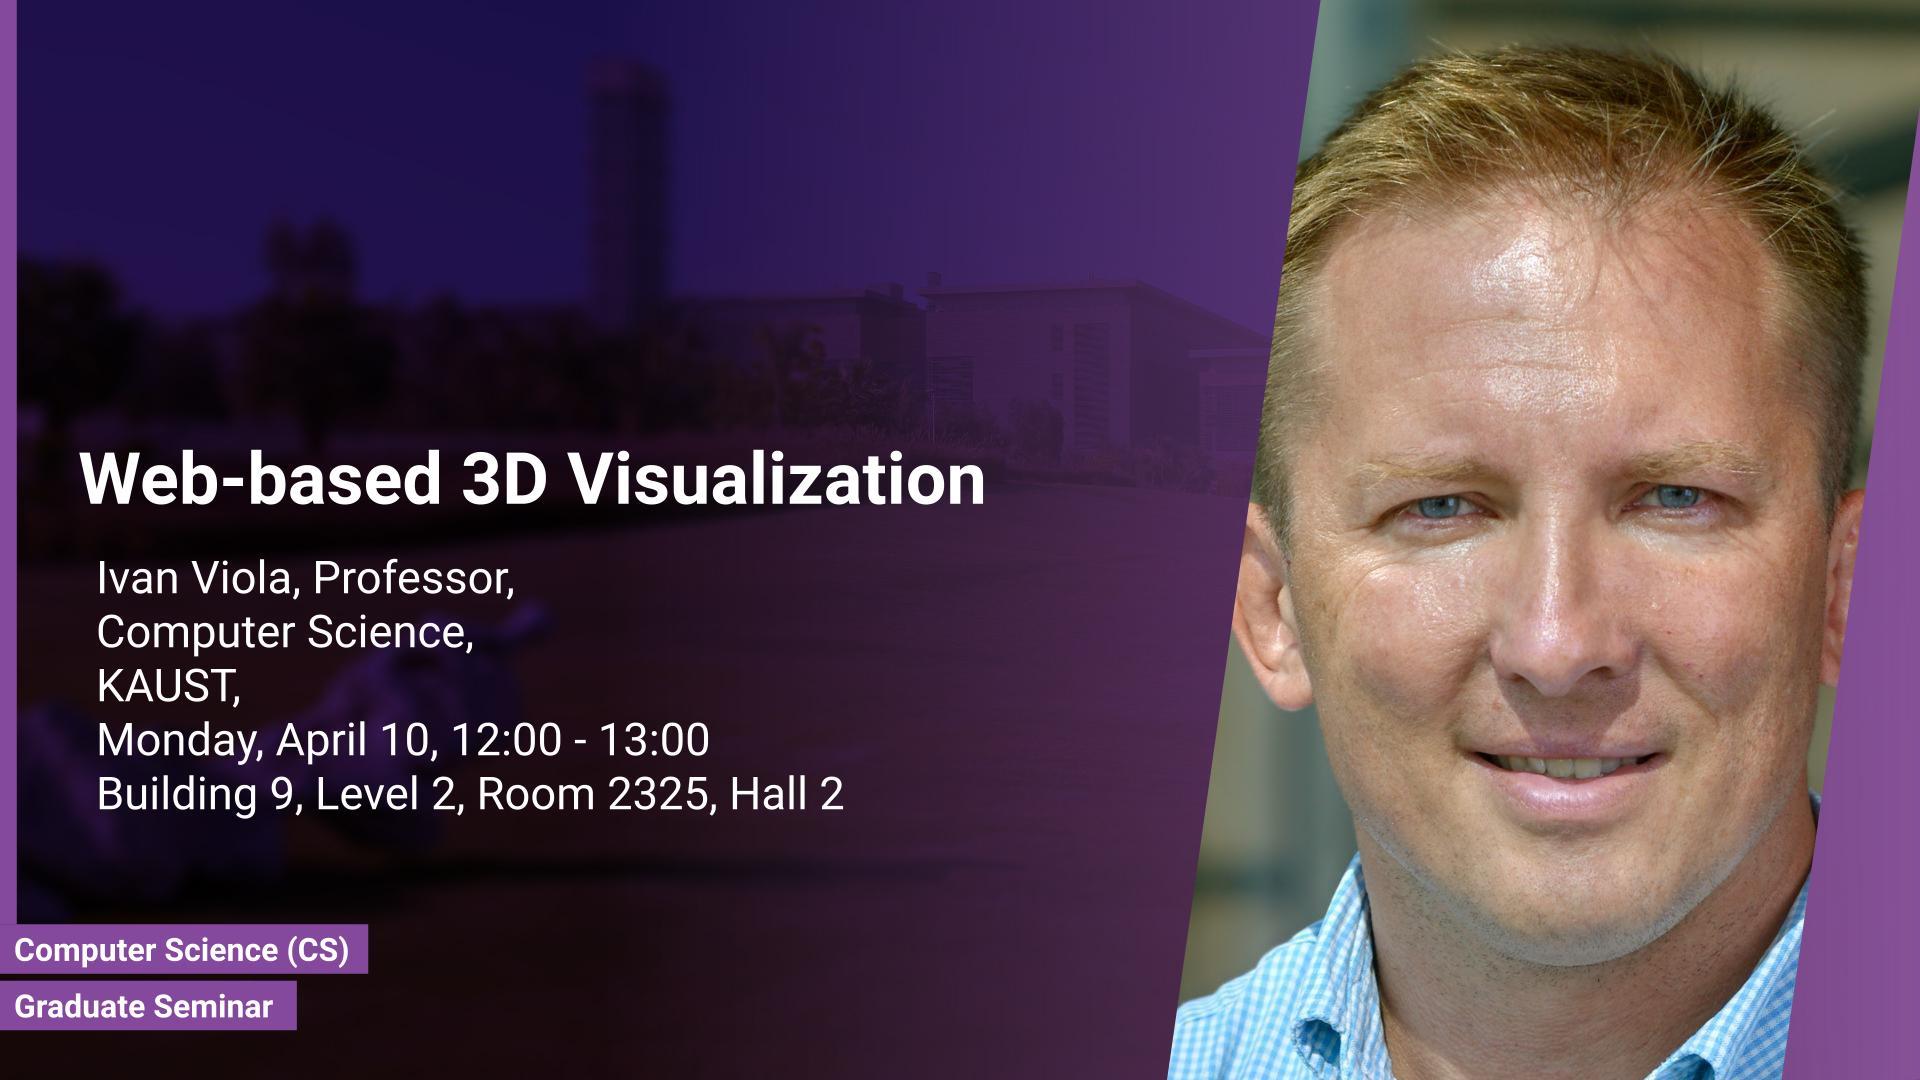
Monday, April 10, 2023, 12:00
- 13:00
Building 9, Level 2, Room 2325, Hall 2
Contact Person
In this seminar I will present how to create 3D computer graphics and visualization systems for the web, using WebAssmbly and WebGPU language specifications, which are new, bleeding-edge technologies. Previously, accelerated graphics on the web was based on JavaScript libraries, which is still very popular, but they do not offer detailed memory management and code optimization, necessary for systems requiring high memory load and high computational demands. WebAssembly and WebGPU can be compiled from the C++ or Rust code, which also allows the deployment of the same codebase either for web or for the desktop-based applications.
Prof.Oliver Deussen, Visual Computing, University of Konstanz
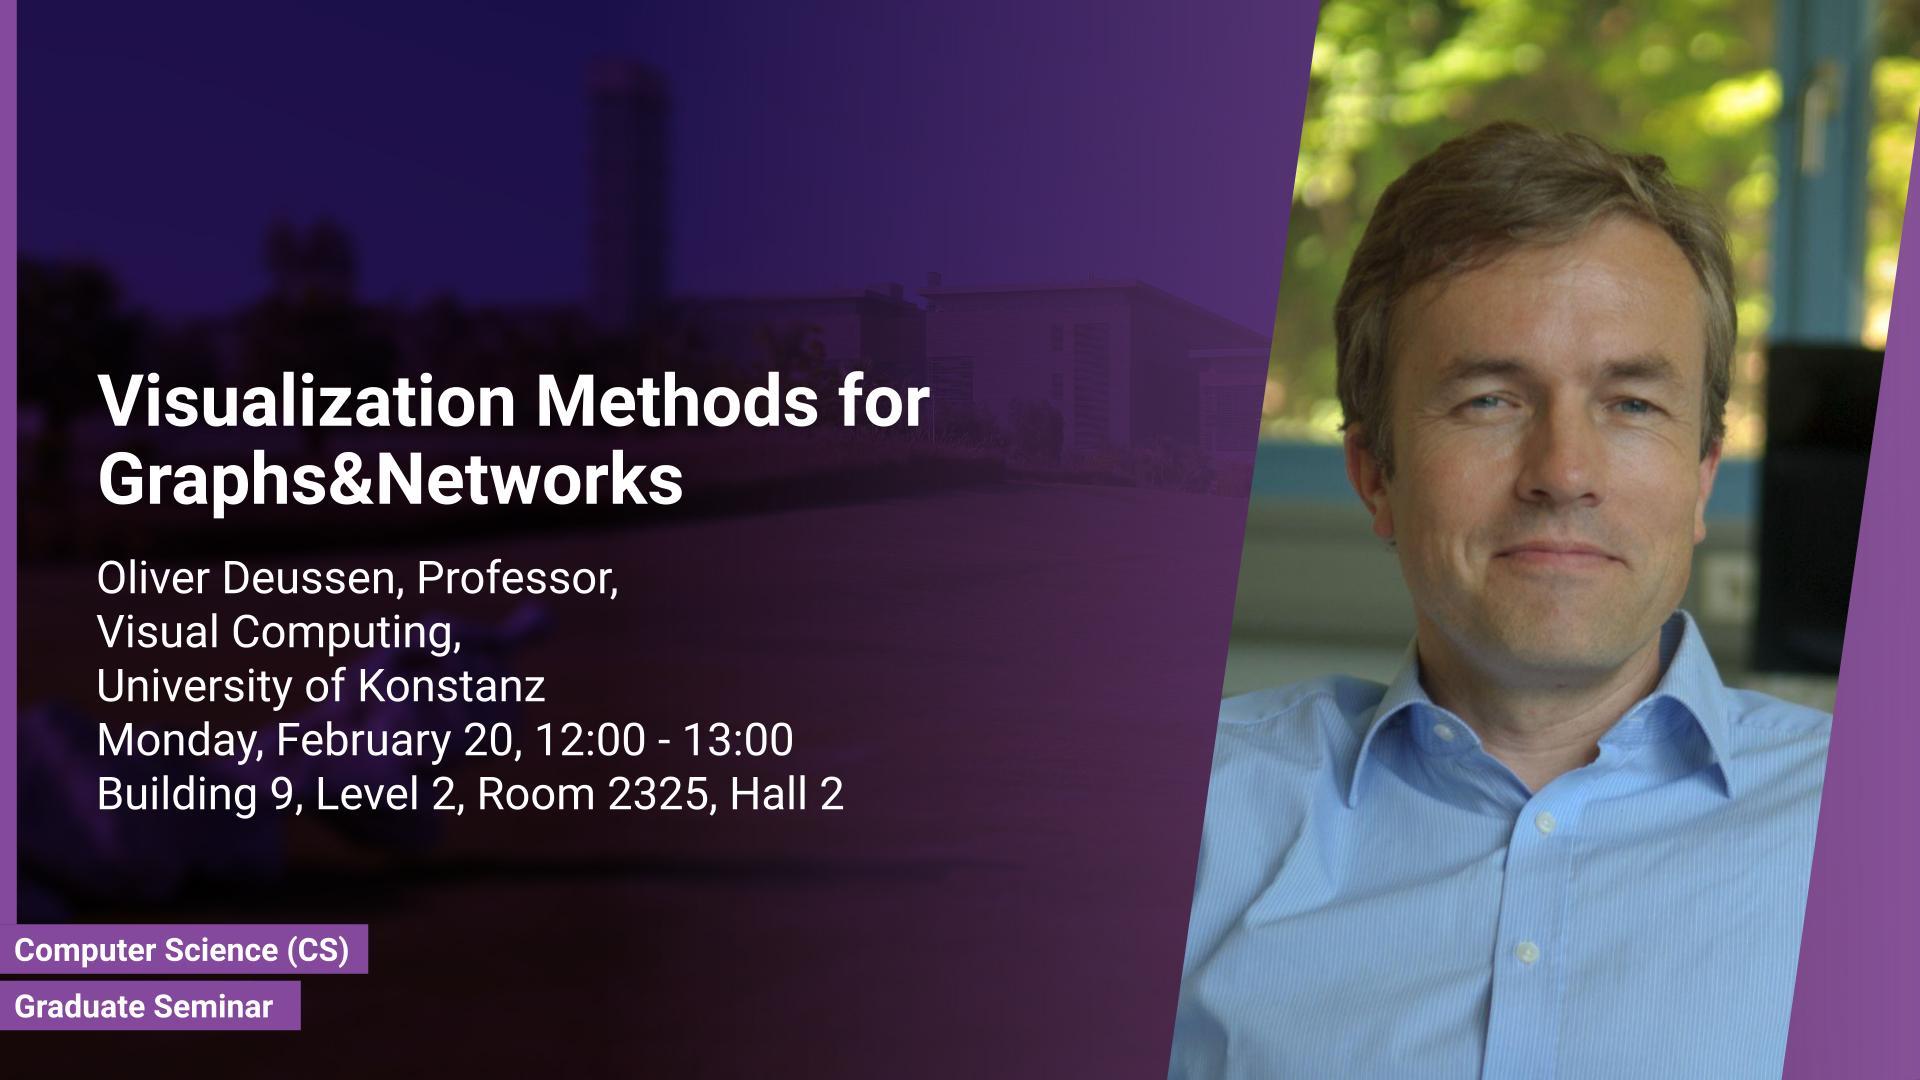
Monday, February 20, 2023, 12:00
- 13:00
Building 9, Level 2, Room 2325, Hall 2
Contact Person
Inevitably, the projection of most graph structures on two-dimensional screens will create errors and therefore visually wrong impressions. In the past, two types of methods have been developed to minimize projection errors and distribute them in a visually pleasing way. The first group of methods, force-directed layouts, interpret the links of a graph as physical springs, while stress-based methods minimize an energy function, which aims to map graph distances faithfully.
Tobias Isenberg, Senior Research Scientist, Inria
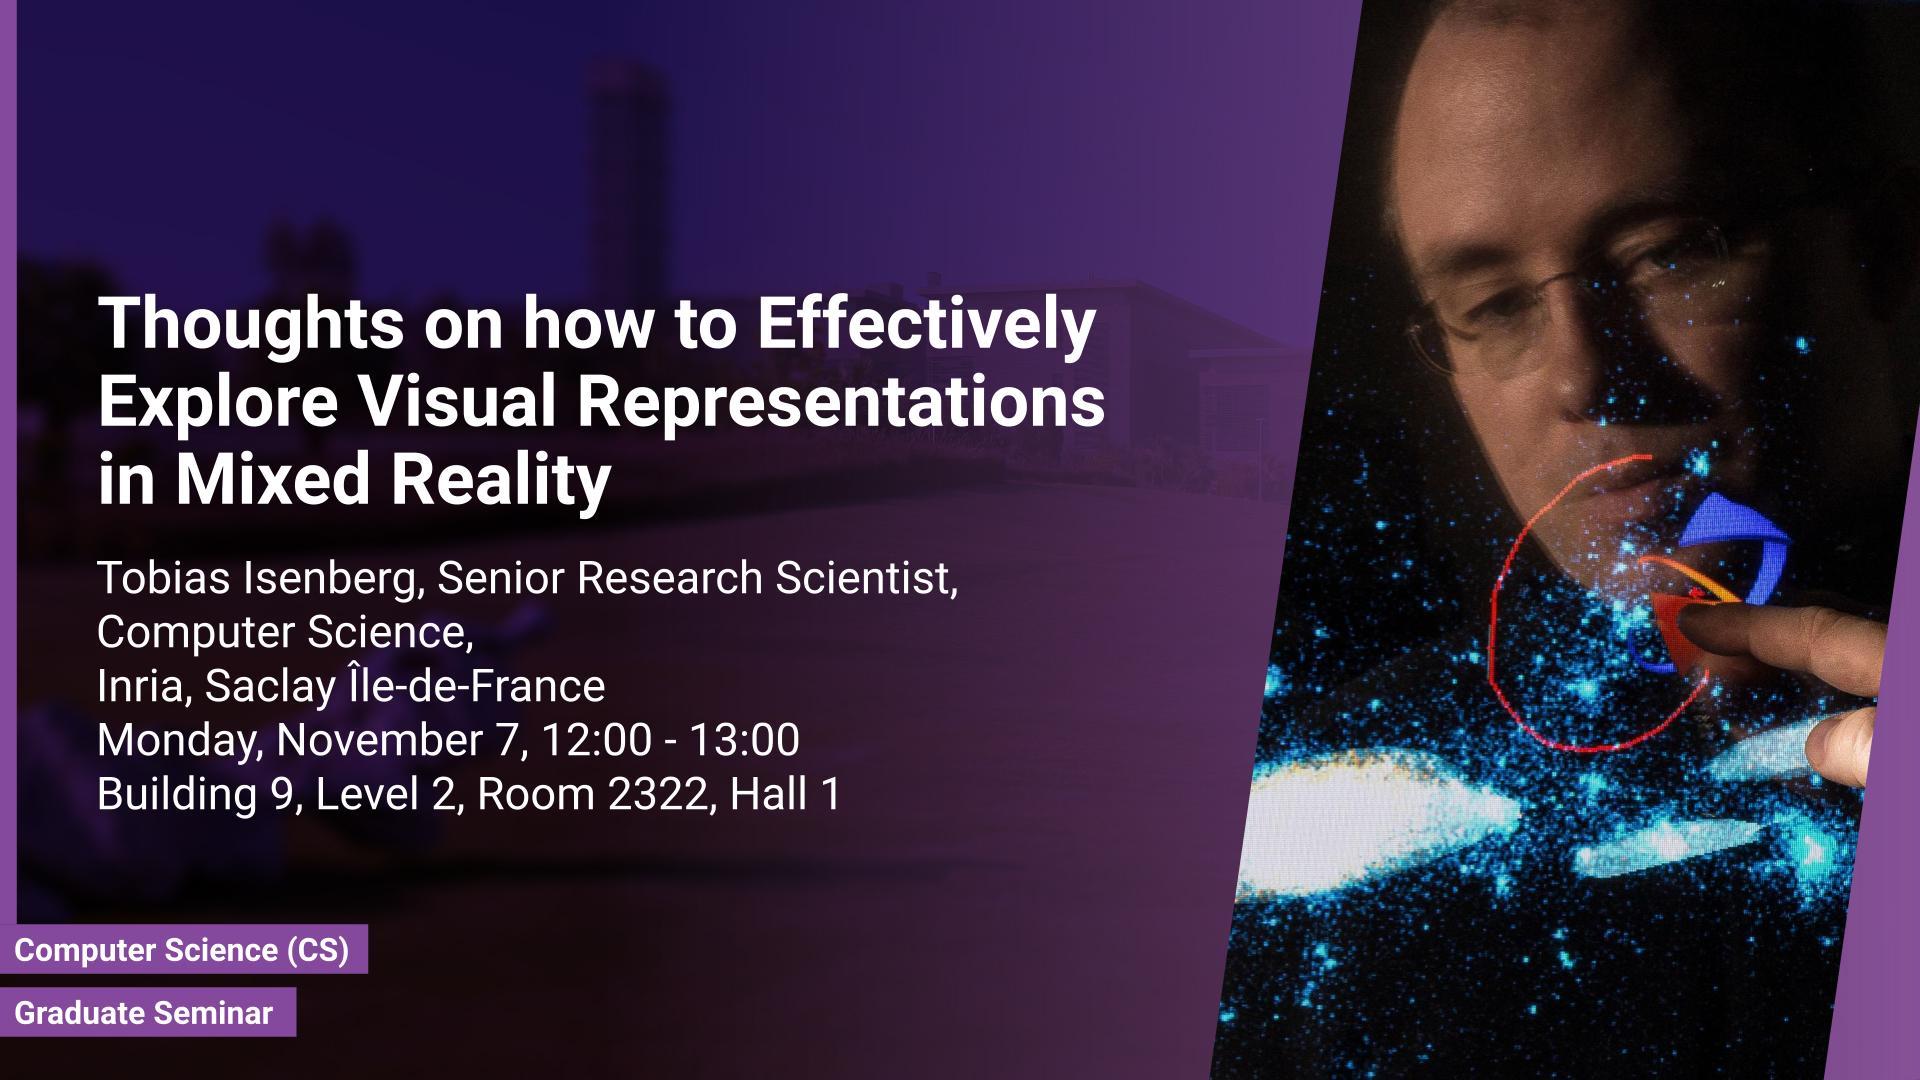
Monday, November 07, 2022, 12:00
- 13:00
Building 9, Level 2, Room 2322, Hall 1
Contact Person
In this talk I will report on various research projects that I carried out with my students to better understand the interaction landscape and will report on lessons we learned. I will focus mostly on AR-based setups with application examples from physical flow visualization, molecular visualization, visualization of particle collisions, biomolecular dynamics in cells, and oceanography. I will show interaction techniques that rely on purely gestural interaction, phones or tablets as input and control devices, and hybrid setups that combine traditional workstations with AR views. I will discuss navigation, data selection, and visualization system control as different interaction tasks. With this overview I aim to provide an understanding of typical challenges in immersive visualization environments and how to address some of these challenges.
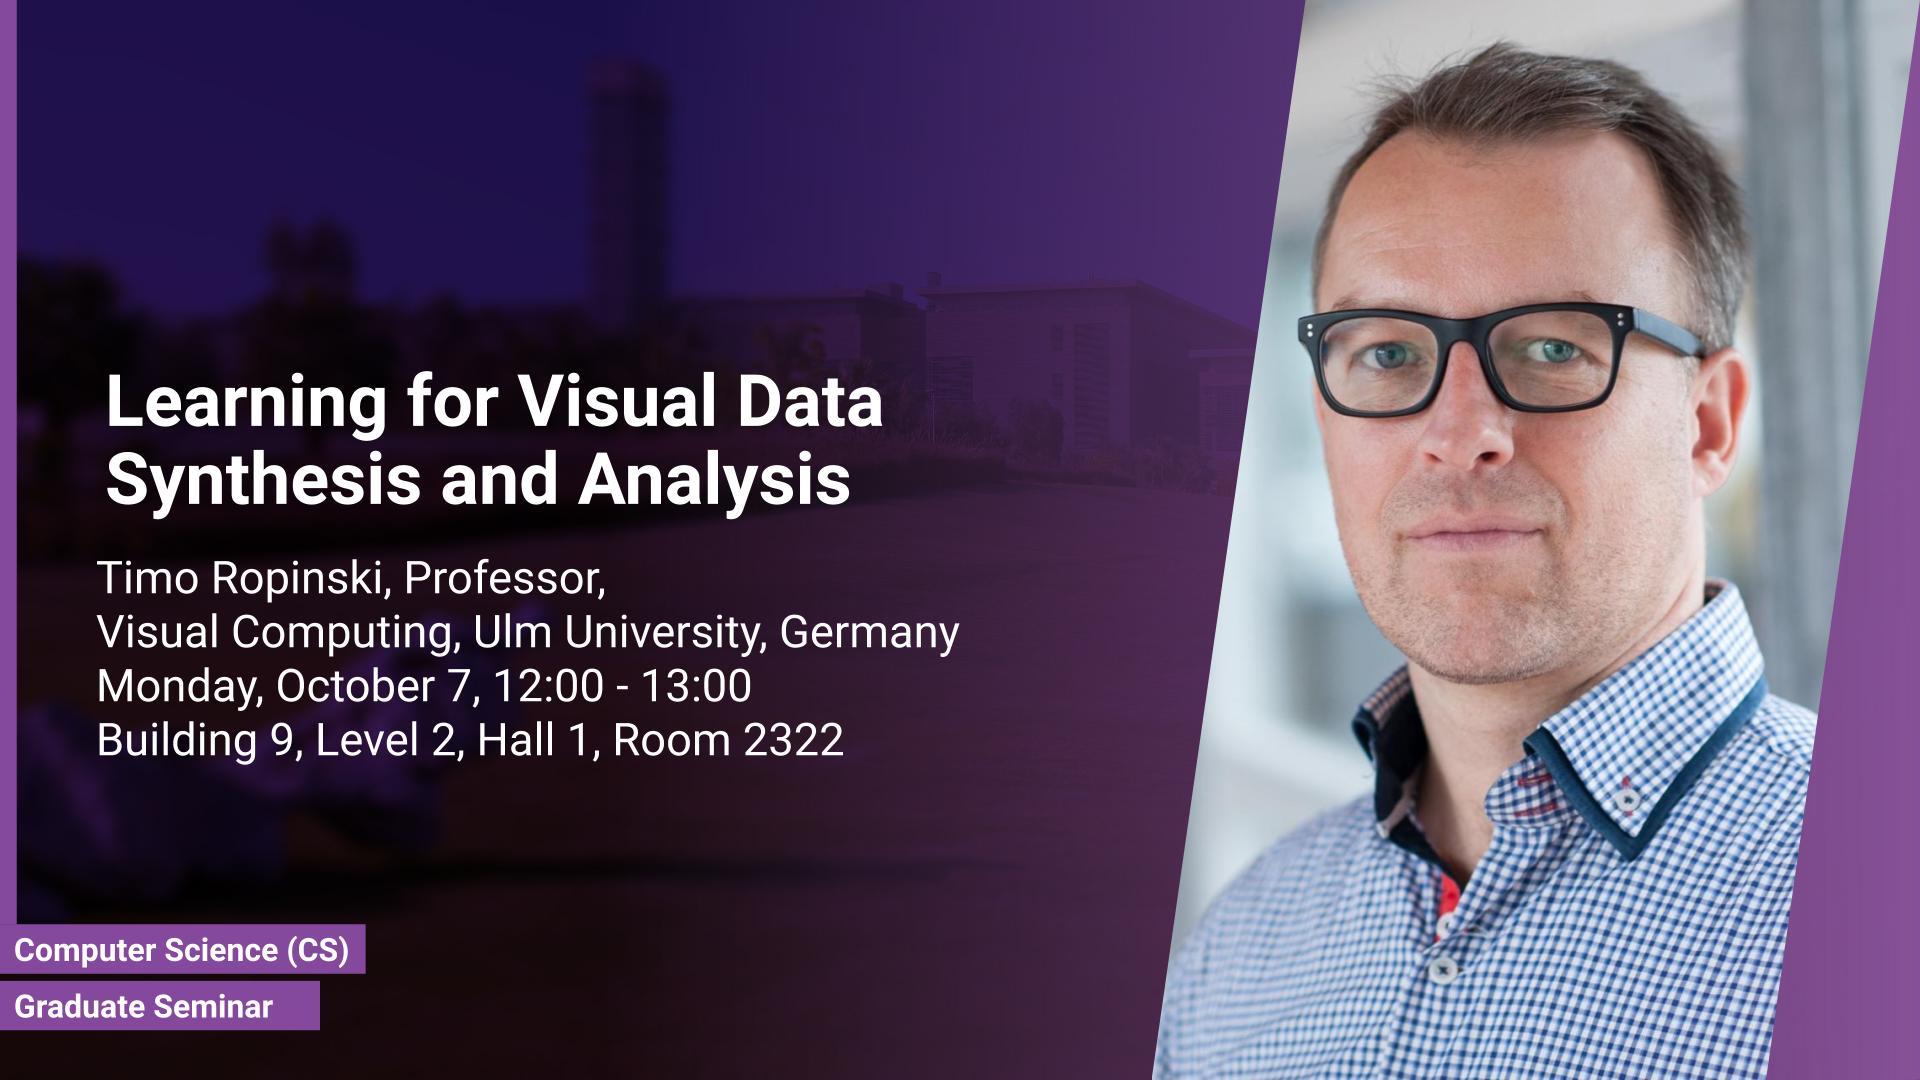
Dr. Timo Ropinski, Professor, Visual Computing, Ulm University, Germany
Monday, October 07, 2019, 12:00
- 13:00
Building 9, Level 2, Hall 1, Room 2322
Contact Person

Abstract

In this talk, I will present our recent advances in deep learning to synthesize and analy

Dr. Yunhai Wang, Professor, Computer Science, Shandong University, China
Wednesday, October 02, 2019, 12:00
- 13:00
Building 9, Level 2, Hall 2, Room 2325
Contact Person

Abstract

By providing visual representations of data, visualization can

Dr. Ciril Bohak, Postdoctoral Researcher, Faculty of Computer and Information Science, University of Ljubljana, Slovenia
Wednesday, September 25, 2019, 13:00
- 14:00
Building 1, Level 2, VCC Lecture Room
Contact Person

Abstract

Our ongoing research on the reconstruction of aerial point cloud data includes reconstruc

Prof. Xiaoru Yuan, Peking University
Monday, April 15, 2019, 12:00
- 13:00
Building 9, Level 2, Hall 1, Room 2322
Contact Person
In this talk, I will introduce a few recent works on tree visualization. First I will present a  visualization technique for comparing topological structures and node attribute values of multiple trees. I will further introduce GoTree, a declarative grammar supporting the creation of a wide range of tree visualizations. In the application side, visualization and visual analytics on social media  will be introduced. The data from social media can be considered as graphs or trees with complex attributes. A few approaches using map metaphor for social media data visualization will be discussed.