© 2018 KAUST
The latest advances in computing and virtual reality (VR) have enabled researchers at KAUST to develop a suite of apps that allow users to visualize and interpret large and complex datasets in three dimensions.
Statistical modeling has traditionally relied on high-resolution maps of large and complex spatio-temporal datasets, which contain data that vary by location and time. This type of modeling helps scientists to understand relationships within the data and how they vary over time; it also helps them to quantify uncertainties.
Advances in computing power and the advent of fully immersive VR, however, offer new and more powerful tools for analyzing data, allowing statisticians to visualize, explore and assess data, leading to more accurate models.
“New statistical applications for modeling data in space and time, especially in the context of global data, are focusing on how we can represent a model that looks like the original data,” explains Marc Genton from KAUST. “This has led us to investigate the role of visualization, particularly VR, to generate maps visually similar to the original data.”
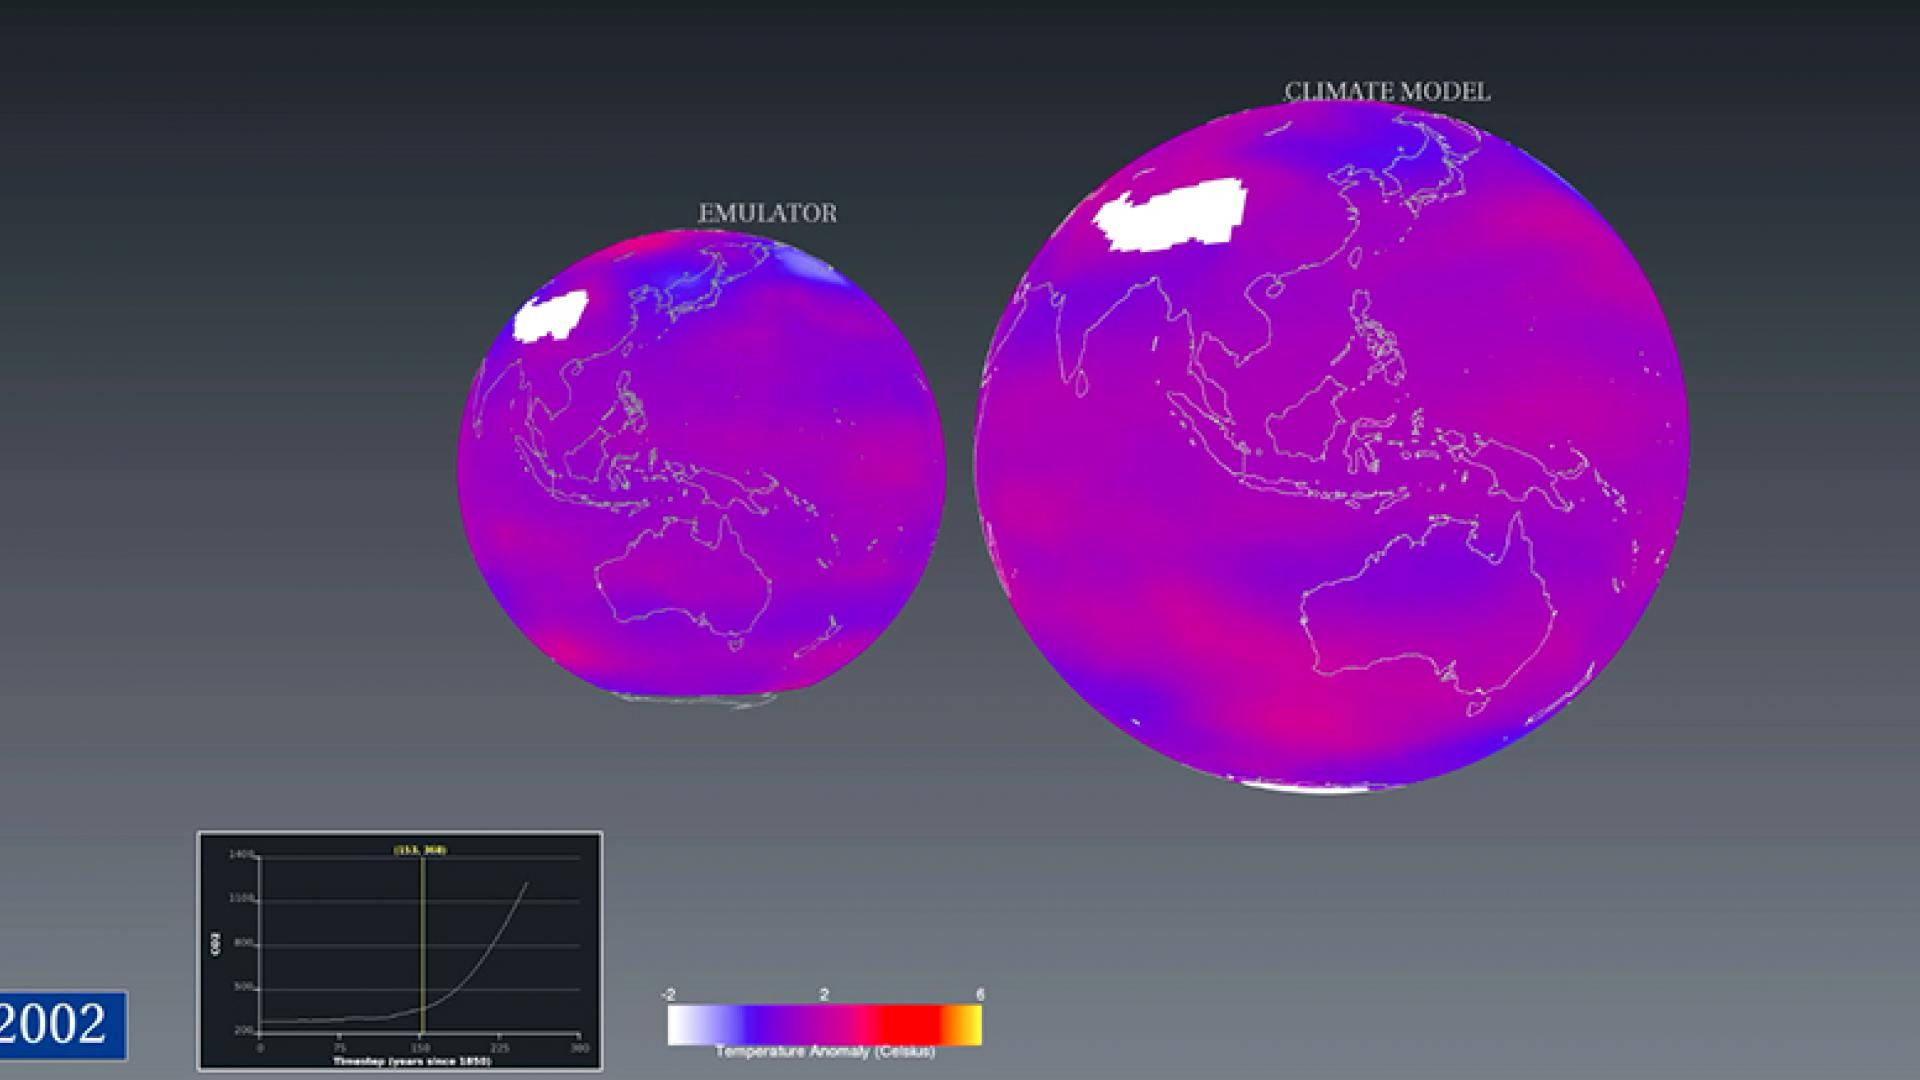
Pioneers in the use of VR and immersive technologies for visualizing real-world datasets, KAUST faculty Genton and Ying Sun, in collaboration with Stefano Castruccio from the University of Notre Dame in the United States, worked with the KAUST Visualization Core Laboratory, a state-of-the-art facility that offers a fully immersive VR environment to realize their app. The team used global temperature data from 2006 to 2100 to compare a climate model with a simulation from a statistical model, called an emulator. By using a VR headset with wireless motion capture technology, users could interactively explore features of the data, allowing them to compare how visually similar the climate model was to the emulator.
“The ability to visually explore data in a three-dimensional, immersive environment will offer a more powerful tool for interpreting data than two-dimensional, planar mapping,” says Sun.
Read the full article
Related Persons