Abstract
Welcome to the new semester! This talk will give an overview of the research of the High-Performance Visualization research group (vccvisualization.org) at the KAUST Visual Computing Center (VCC). Interactive visualization is crucial to exploring, analyzing, and understanding large-scale scientific data, such as the data acquired in medicine or neurobiology using computed tomography or electron microscopy, and data resulting from large-scale simulations such as fluid flow in the Earth’s atmosphere and oceans. The amount of data in data-driven science is increasing rapidly toward the petascale and further. This presents a tremendous challenge to interactive visualization and analysis. Nowadays, an important enabler of interactivity is often the parallel processing power of GPUs. This, however, requires well-designed customized data structures and algorithms. We will look at selected research projects in large-scale volume as well as flow visualization, describe the corresponding GPU data structures, and give a brief overview of new mathematical techniques that we have developed for the visualization of flow features.
Brief Biography
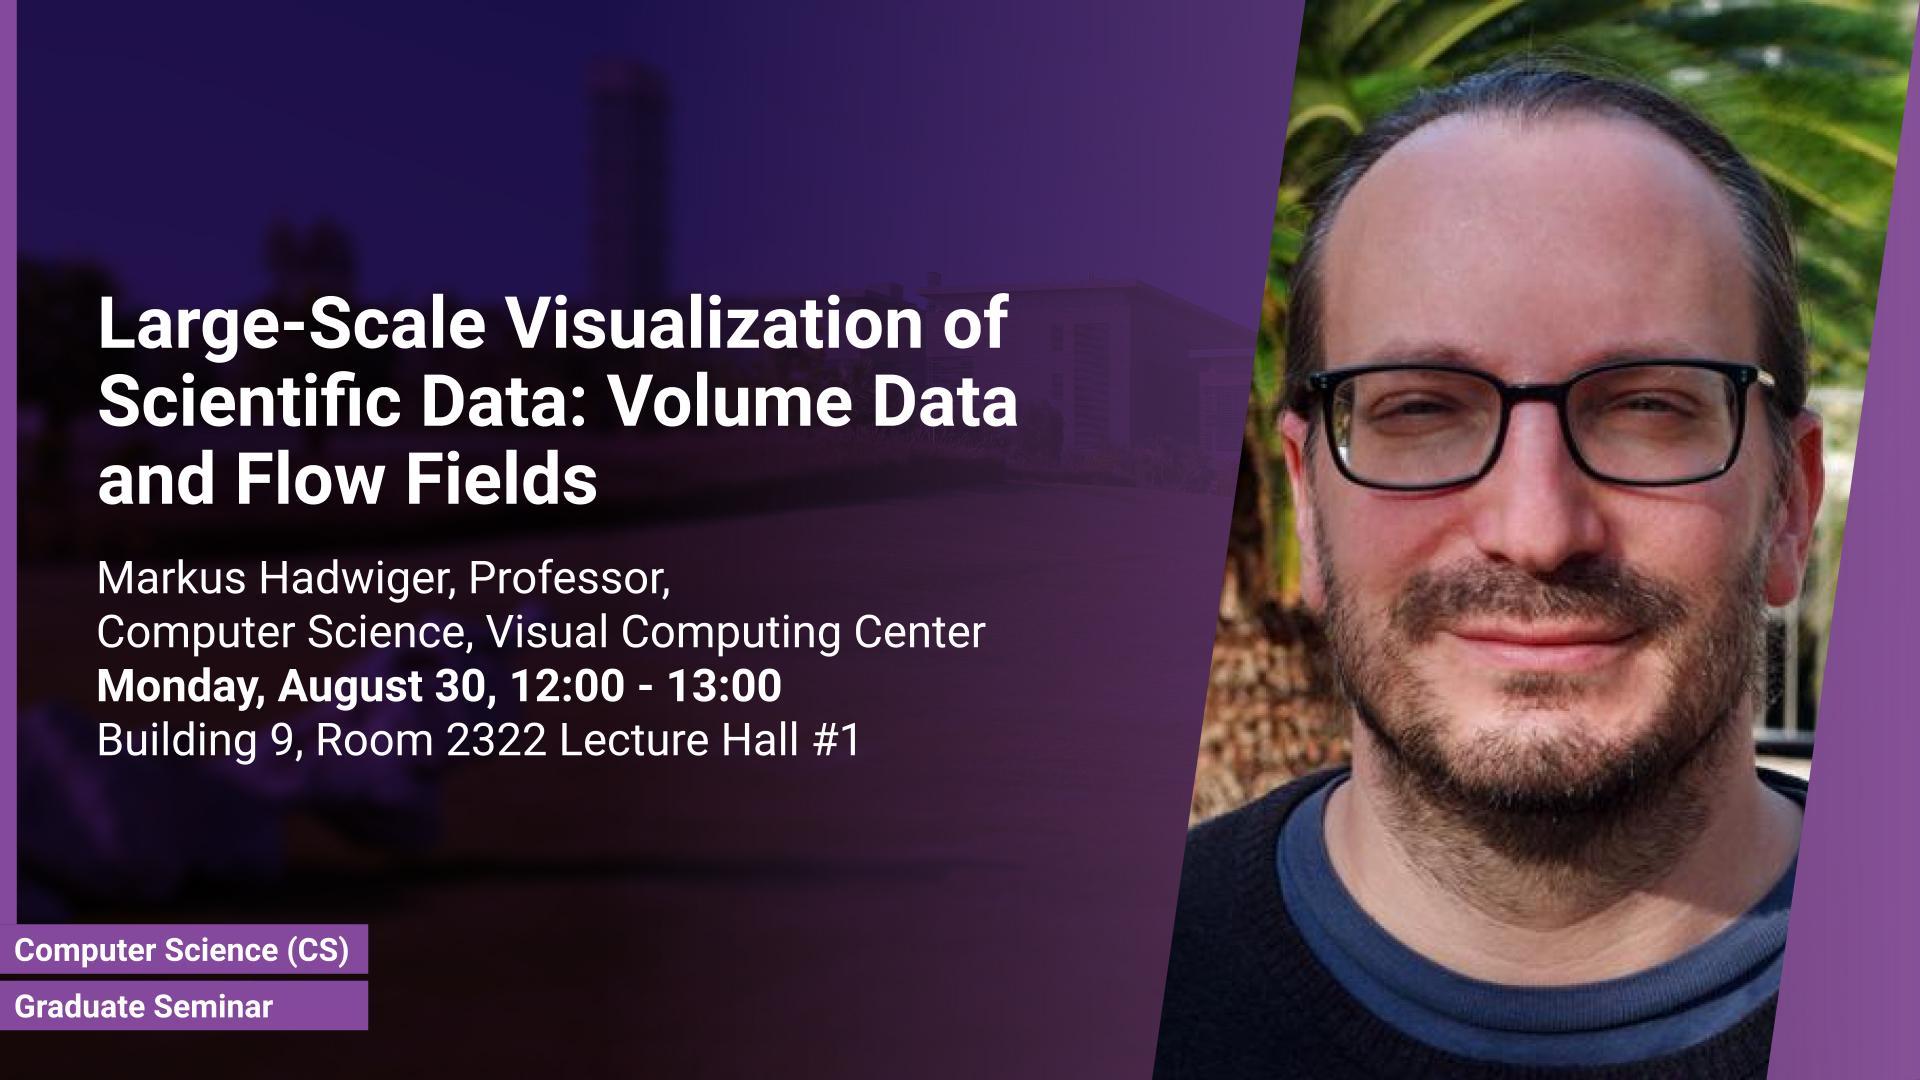
Markus Hadwiger is a Professor in CEMSE/CS and the Visual Computing Center (VCC) at KAUST, which he joined in October 2009. He leads the High-Performance Visualization research group at VCC. His research interests in the area of extreme-scale visual computing and scientific visualization, in particular volume visualization, flow visualization, medical and biological visualization, differential geometry and mathematical physics in visualization, image and volume processing, multi-resolution techniques, data streaming and out-of-core processing, interactive segmentation, and GPU algorithms and architecture. He is a co-author of the book Real-Time Volume Graphics published in 2006 and has been involved in many courses and tutorials about volume rendering and visualization at ACM SIGGRAPH, ACM SIGGRAPH Asia, IEEE Visualization, and Eurographics.
Contact Person
Related Persons